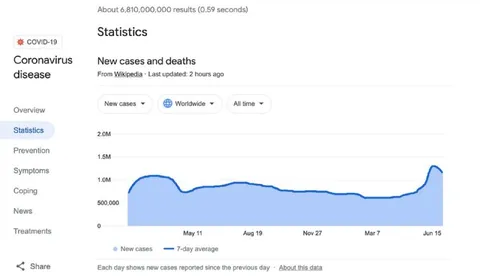
COVID Cases Suddenly Spike
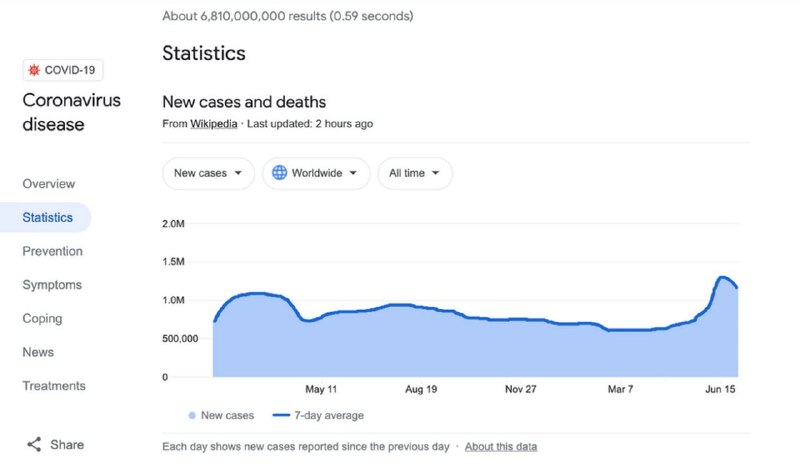
About 6,810,000,000 results (0.59 seconds) Statistics COVID-19 Coronavirus disease Overview Statistics Prevention Symptoms Coping News Treatments New cases and deaths From Wikipedia · Last updated: 2 hours ago New cases Worldwide All time 2.0M 1.5M 1.0M 500,000 0 May 11 Aug 19 Nov 27 Mar 7 Jun 15 New cases 7-day average Each day shows new cases reported since the previous day · About this data Share
A Google-style COVID-19 statistics page shows a graph of new cases staying relatively level for months before suddenly shooting upward near June 15. The joke is the exaggerated late spike, making the chart look like the pandemic is dramatically returning and serving as a reaction to any situation that suddenly gets much worse. EN: A Google-style COVID-19 statistics page shows a graph of new cases staying relatively level for months before suddenly shooting upward near June 15. The joke is the exaggerated late spike, making the chart look like the pandemic is dramatically returning and serving as a reaction to any situation that suddenly gets much worse.
COVID-19 statistics page / страница статистики COVID-19line graph / линейный графикblue area chart / синяя площадная диаграммаspike in graph / резкий скачок на графикеsidebar menu / боковое менюsearch results header / заголовок результатов поискаWorldwide filter / фильтр «Worldwide»All time filter / фильтр «All time»date labels / обозначения датshare icon / значок «Поделиться»
- @afrosidemoon / 40858 2021-07-07
- @jeppa420 / 19034 2021-07-07
- Type
- image
- Size
- 800×464 · 31.9 KiB
- Mood
- саркастичный, абсурдный
- Language
- en
- Added