GitHub Contribution Graph Life
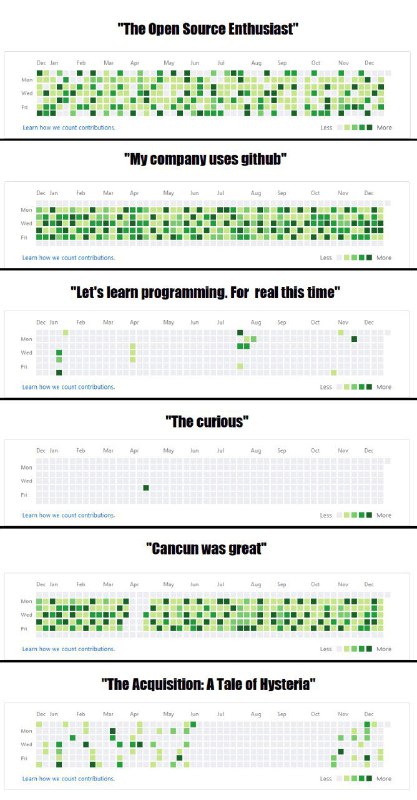
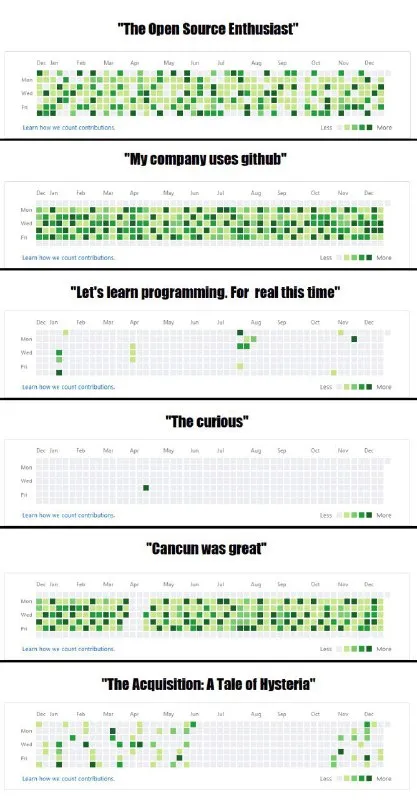
"The Open Source Enthusiast" Dec Jan Feb Mar Apr May Jun Jul Aug Sep Oct Nov Dec Mon Wed Fri Learn how we count contributions. Less More "My company uses github" Dec Jan Feb Mar Apr May Jun Jul Aug Sep Oct Nov Dec Mon Wed Fri Learn how we count contributions. Less More "Let's learn programming. For real this time" Dec Jan Feb Mar Apr May Jun Jul Aug Sep Oct Nov Dec Mon Wed Fri Learn how we count contributions. Less More "The curious" Dec Jan Feb Mar Apr May Jun Jul Aug Sep Oct Nov Dec Mon Wed Fri Learn how we count contributions. Less More "Cancun was great" Dec Jan Feb Mar Apr May Jun Jul Aug Sep Oct Nov Dec Mon Wed Fri Learn how we count contributions. Less More "The Acquisition: A Tale of Hysteria" Dec Jan Feb Mar Apr May Jun Jul Aug Sep Oct Nov Dec Mon Wed Fri Learn how we count contributions. Less More
A six-panel meme compares GitHub contribution graphs for different situations: an open-source enthusiast contributes constantly, a company using GitHub shows steady activity, learning programming produces little activity, curiosity produces almost none, a great vacation produces a burst of contributions, and an acquisition creates chaotic activity. The joke is that the shape of a contribution calendar reveals what someone was really doing, often contradicting the caption. EN: A six-panel meme compares GitHub contribution graphs for different situations: an open-source enthusiast contributes constantly, a company using GitHub shows steady activity, learning programming produces little activity, curiosity produces almost none, a great vacation produces a burst of contributions, and an acquisition creates chaotic activity. The joke is that the shape of a contribution calendar reveals what someone was really doing, often contradicting the caption.
- @profunctor_io / 1557 2018-12-24
- Template
- GitHub contribution graph meme
- Type
- image
- Size
- 417×800 · 73.3 KiB
- Mood
- sarcastic, absurd
- Language
- en
- Added