Benford's Law Election Data
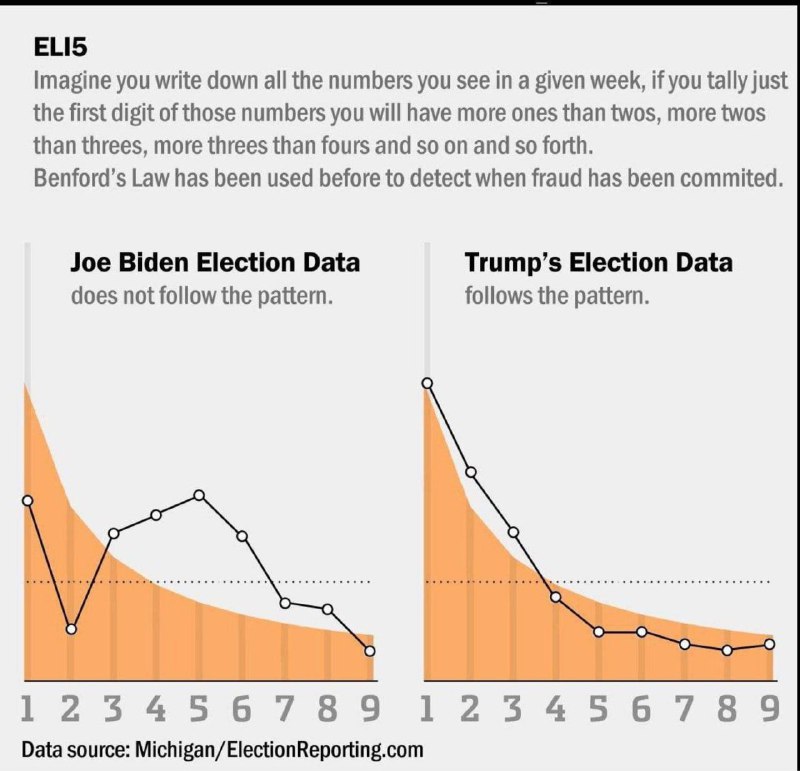
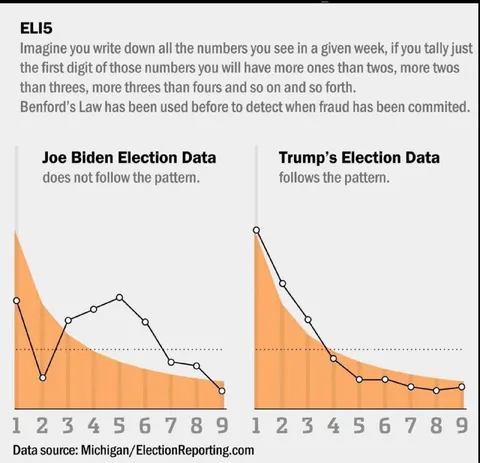
ELI5 Imagine you write down all the numbers you see in a given week, if you tally just the first digit of those numbers you will have more ones than twos, more twos than threes, more threes than fours and so on and so forth. Benford’s Law has been used before to detect when fraud has been committed. Joe Biden Election Data does not follow the pattern. Trump’s Election Data follows the pattern. Data source: Michigan/ElectionReporting.com
A two-panel infographic compares Joe Biden’s and Donald Trump’s election data using Benford’s Law. The joke implies that Biden’s data does not match the expected statistical pattern while Trump’s does, suggesting election fraud; it is typically shared as a partisan reaction about election integrity and alleged voter fraud. EN: A two-panel infographic compares Joe Biden’s and Donald Trump’s election data using Benford’s Law. The joke implies that Biden’s data does not match the expected statistical pattern while Trump’s does, suggesting election fraud; it is typically shared as a partisan reaction about election integrity and alleged voter fraud.
infographic / инфографикаtwo-panel chart / двухпанельный графикline graph / линейный графикorange shaded distribution / оранжевая заштрихованная областьdata points / точки данныхnumbers one through nine / числа от одного до девятиdotted reference line / пунктирная линия сравненияelection data / данные выборовstatistical pattern / статистическая закономерностьsource label / подпись источника
- @right_wing_dev_squads / 528 2020-11-09
- Type
- image
- Size
- 800×771 · 77.2 KiB
- Mood
- partisan, accusatory
- Language
- en
- Added