Thermal Comfort Around the Horse
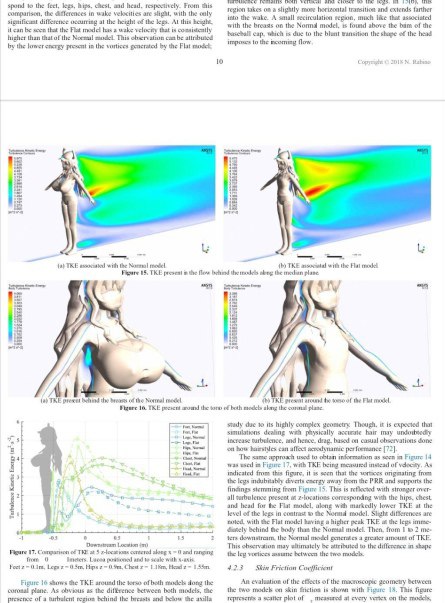
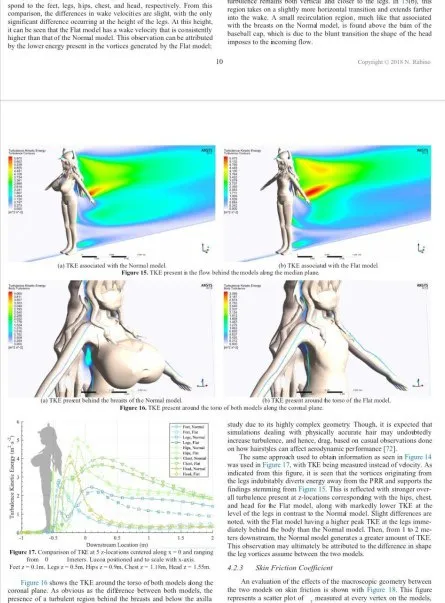
spand to the feet, legs, hips, chest, and head, respectively. From this comparison, the differences in wake velocities are slight, with the only significant difference occurring at the height of the legs. At this height, it can be seen that the fluid wake is substantially wider in comparison higher than that of the Normal model. This observation can be attributed to the lower energy present in the vortices generated by the Flat model. reduced terms from vertical and closer to the legs. In (5), this region takes on a slightly more horizontal transition and extends farther into the wake. A small recirculation region, much like that associated with the breast, can be observed in the lower part of the baseball cap, which is due to the blunt transition the shape of the head imposes to the incoming flow. (a) TKE associated with the Normal model. (b) TKE associated with the Flat model. Figure 15. TKE present in the flow behind the models along the averaged plane. (a) TKE present behind the breasts of the Normal model. (b) TKE present around the torso of the Flat model. Figure 16. TKE present around the bodies of the models along the averaged plane. Figure 17. Comparison of TKE at z-location centered along x = 11 and ranging from -0.0 m to 0.25 m. Iterations placed onto scale with x = 18 and z = 1.5 m. (a) Flat, (b) Normal, (c) ... steady due to its highly complex geometry. Though, it is expected that simulations dealing with physically accurate hair may undoubtedly increase turbulence, and hence, drag based on causal observations on both surfaces can affect aerodynamic performance [72]. The same approach used to obtain information as seen in Figure 14 was used in Figure 17, with TKE being measured instead of velocity. As indicated from this figure, it can be seen that the increased vorticity from the legs instability events energy away from the PR and supports the findings stemming from Figure 15. This is found from stronger vortices that would be present at z-locations crossing the hips, chest, and head for the Flat model, along with the lower TKE at the level of the legs in contrast to the Normal model. Slight differences are noted, with the Flat body having a higher peak TKE at the legs immediately behind the body than the Normal model. Then, from 1 to 2 meters downstream, the Normal model appears to be a higher peak TKE. This observation may ultimately be attributed to the difference in shape of the two surfaces between the two models. An evaluation of the effects of the microscopic geometry between the two models on fluid flow is shown with Figure 18. This figure represents a scatter plot of measured at every vertex on the models,
На изображении показана страница научной статьи с компьютерными моделями человеческих тел и цветными картами турбулентной кинетической энергии (TKE), особенно вокруг груди, таза, ног и головы. Комичность возникает из-за неожиданно академического и чрезмерно подробного анализа обнажённой анатомии и формулировок вроде «TKE present around the bodies», что превращает техническую иллюстрацию в абсурдную реакцию на чрезмерный научный разбор внешности. EN: The image shows a page from a scientific paper with computer models of human bodies and colorful maps of turbulent kinetic energy (TKE), especially around the chest, hips, legs, and head. The humor comes from the unexpectedly academic and extremely detailed analysis of nude anatomy and phrases such as “TKE present around the bodies,” turning a technical illustration into an absurd reaction to overanalyzing someone’s appearance scientifically.
- @eternalclassic / 24898 2022-12-16
- @rzeczyzabawne / 4292 2022-12-16
- Type
- image
- Size
- 445×603 · 67.0 KiB
- Mood
- absurd, саркастичный
- Language
- en
- Added