Self-Referential Graph Plot
k k + 5 k + 10 k + 15 100 90 80 70 60 50 40 30 20 10 0
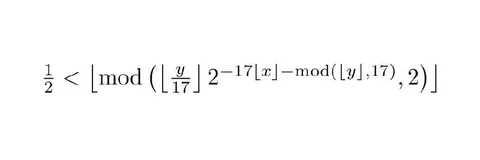
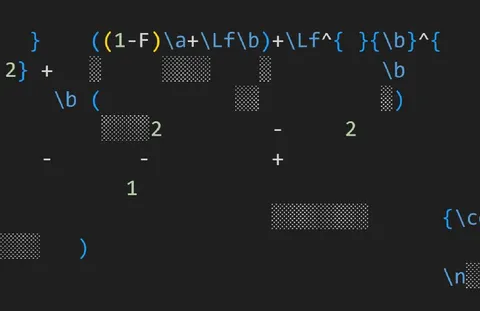
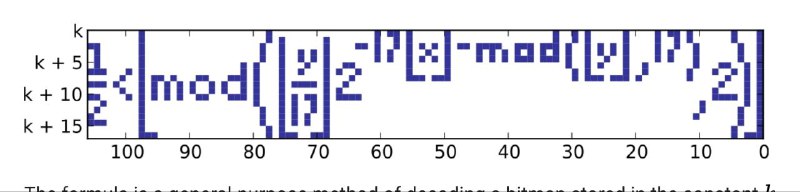
A graph displays a pixelated mathematical expression across its coordinate grid. The joke is that plotting the inequality produces a plot that visually references itself, creating a self-referential mathematical gag.
- @beobanka / 61109 2026-09-11
- Type
- image
- Size
- 800×192 · 28.2 KiB
- Mood
- absurd, clever
- Added