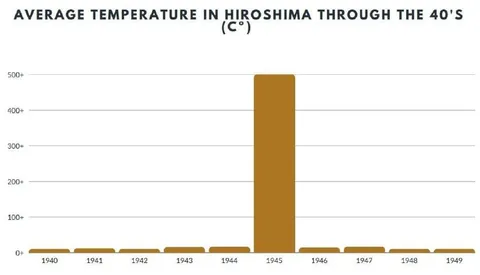
Hiroshima Temperature Chart
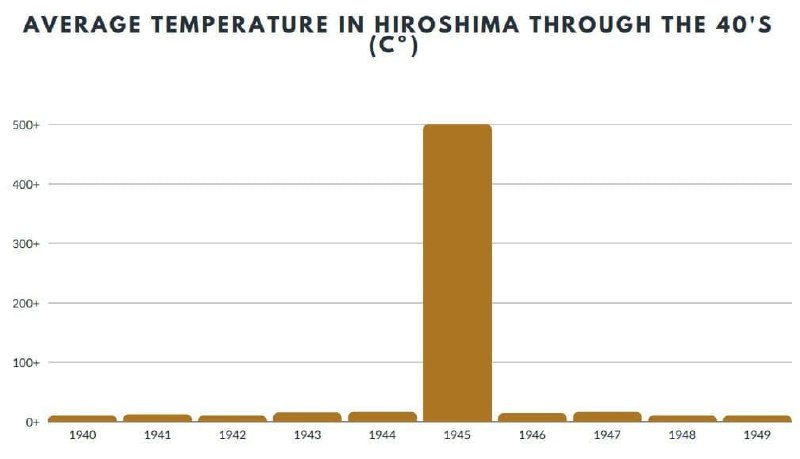
AVERAGE TEMPERATURE IN HIROSHIMA THROUGH THE 40'S (°C°) 500+ 400+ 300+ 200+ 100+ 0+ 1940 1941 1942 1943 1944 1945 1946 1947 1948 1949
A bar chart supposedly showing the average temperature in Hiroshima through the 1940s. Every year has a tiny bar except 1945, which shoots up to 500+, darkly implying the atomic bombing rather than an actual temperature measurement. It is used as a morbid history joke or reaction to absurdly exaggerated charts. EN: A bar chart supposedly showing the average temperature in Hiroshima through the 1940s. Every year has a tiny bar except 1945, which shoots up to 500+, darkly implying the atomic bombing rather than an actual temperature measurement. It is used as a morbid history joke or reaction to absurdly exaggerated charts.
- @jeppa420 / 14391 2021-03-01
- Type
- image
- Size
- 800×459 · 27.8 KiB
- Mood
- dark humor
- Language
- en
- Added