World Death Rate Through Time
World Death Rate Through Time 100% 90% 80% 70% 60% 50% 40% 30% 20% 10% 0% 10,000 BC 5,000 BC 500 AD 1350 AD 1600 AD 1974 AD TODAY
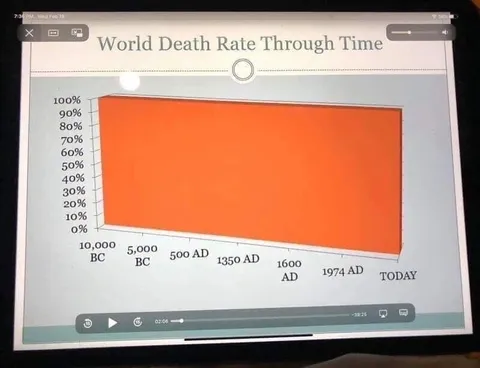
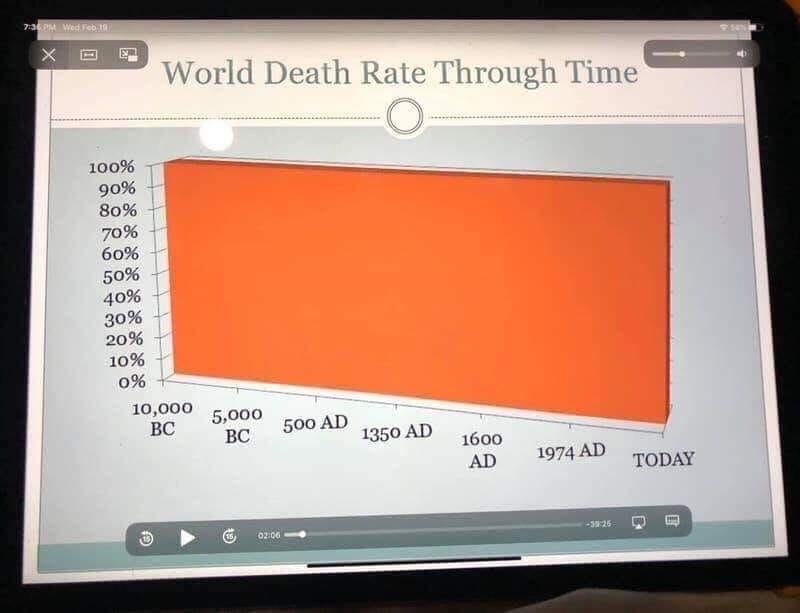
A chart titled “World Death Rate Through Time” shows an orange area staying near 100% from 10,000 BC to today. The joke is that everyone eventually dies, so the graph’s death rate remains effectively constant; it is used as a dry, absurd reaction to mortality or grim situations. EN: A chart titled “World Death Rate Through Time” shows an orange area staying near 100% from 10,000 BC to today. The joke is that everyone eventually dies, so the graph’s death rate remains effectively constant; it is used as a dry, absurd reaction to mortality or grim situations.
- @beobanka / 12 2020-04-02
- Type
- image
- Size
- 800×613 · 40.3 KiB
- Mood
- darkly humorous
- Language
- en
- Added