COVID-19 Death Rates Above Average
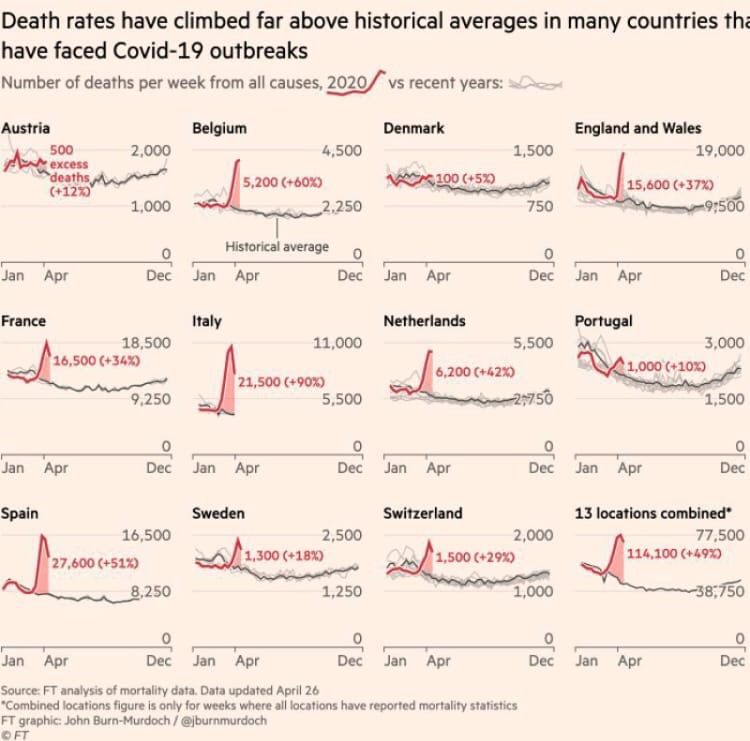
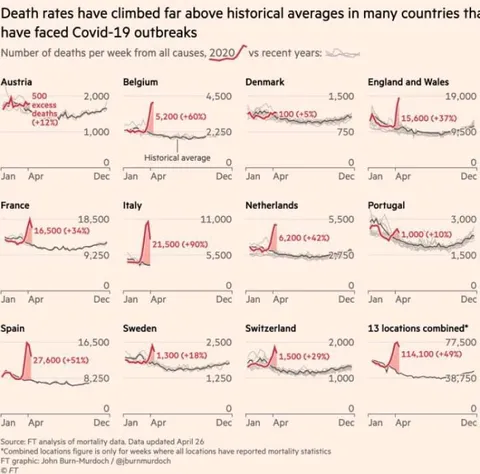
Death rates have climbed far above historical averages in many countries that have faced Covid-19 outbreaks Number of deaths per week from all causes, 2020 vs recent years: Austria 500 excess deaths (+12%) 2,000 1,000 Jan Apr Dec Belgium 4,500 5,200 (+60%) 2,250 Historical average Jan Apr Dec Denmark 1,500 100 (+5%) 750 Jan Apr Dec England and Wales 19,000 15,600 (+37%) 9,500 Jan Apr Dec France 18,500 16,500 (+34%) 9,250 Jan Apr Dec Italy 11,000 21,500 (+90%) 5,500 Jan Apr Dec Netherlands 5,500 6,200 (+42%) 2,750 Jan Apr Dec Portugal 3,000 1,000 (+10%) 1,500 Jan Apr Dec Spain 16,500 27,600 (+51%) 8,250 Jan Apr Dec Sweden 2,500 1,300 (+18%) 1,250 Jan Apr Dec Switzerland 2,000 1,500 (+29%) 1,000 Jan Apr Dec 13 locations combined* 77,500 114,100 (+49%) 38,750 Jan Apr Dec Source: FT analysis of mortality data. Data updated April 26 *Combined locations figure is only for weeks where all locations have reported mortality statistics FT graphic: John Burn-Murdoch / @jburnmurdoch © FT
Инфографика Financial Times показывает, как недельная смертность в 13 странах резко превысила исторические средние значения во время вспышек Covid-19. График подчёркивает масштаб избыточных смертей, особенно в Италии, Испании и объединённых данных по 13 локациям, и используется как серьёзная реакция на пандемию, карантин или спор о последствиях Covid-19.
line chart / линейный графикdeath-rate graph / график смертностиred data line / красная линия данныхgray comparison lines / серые линии сравненияcountry labels / названия странchart grid / сетка графикаpercentage annotations / процентные подписиCOVID-19 outbreak data / данные о вспышке COVID-19historical average line / линия исторического среднегоmonth labels / обозначения месяцевFinancial Times infographic / инфографика Financial Times
- @itvbia / 403 2020-04-30
- Type
- image
- Size
- 750×741 · 62.3 KiB
- Mood
- serious, grim
- Language
- en
- Added