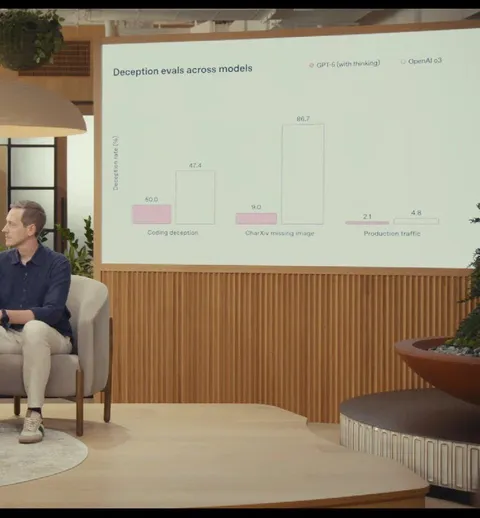
Deception Rate Chart Fail
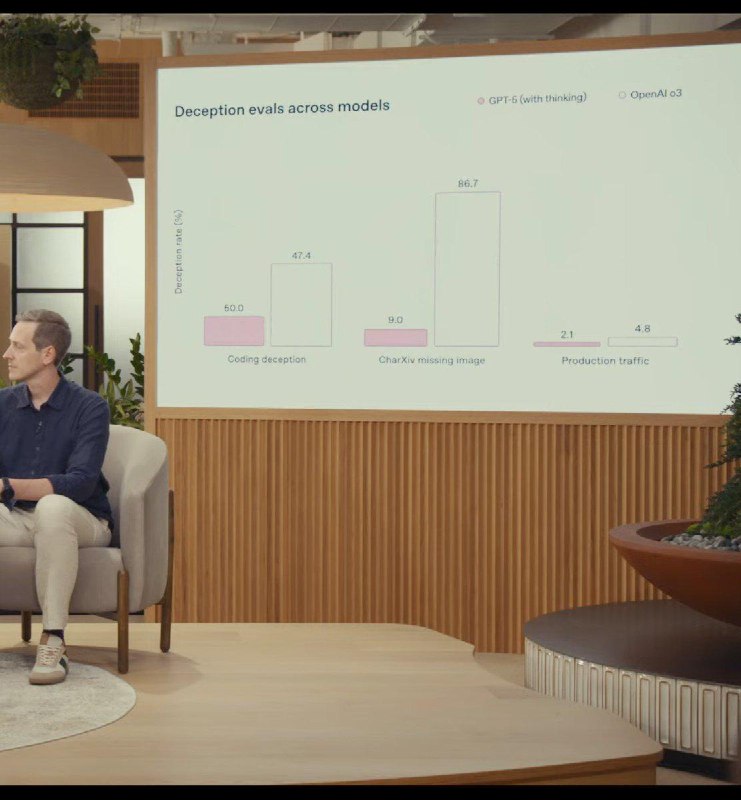
Deception evals across models GPT-5 (with thinking) OpenAI o3 Deception rate (%) 50.0 47.4 Coding deception 9.0 86.7 CharXiv missing image 2.1 4.8 Production traffic
A presentation slide compares deception rates for GPT-5 with thinking and OpenAI o3 across three evaluation categories. The joke is that GPT-5 appears to have the lower deception rate in the chart despite the bars and values showing the opposite in key categories, making the misleading visualization itself the punchline. It is used as a reaction to deceptive statistics, bad data visualization, or ironic presentations.
presentation screen / экран презентацииbar chart / столбчатая диаграммаseated man / сидящий мужчинаnavy shirt / тёмно-синяя рубашкаbeige trousers / бежевые брюкиwhite sneakers / белые кроссовкиarmchair / креслоwooden wall paneling / деревянная стеновая панельpotted plant / растение в горшкеcoffee table / журнальный столикcarpet / ковёрindoor lounge / лаунж-зона в помещении
- @dev_meme / 7011 2025-08-07
- @gentoomemes / 18152 2025-08-07
- Type
- image
- Size
- 741×800 · 73.2 KiB
- Mood
- sarcastic
- Language
- en
- Added