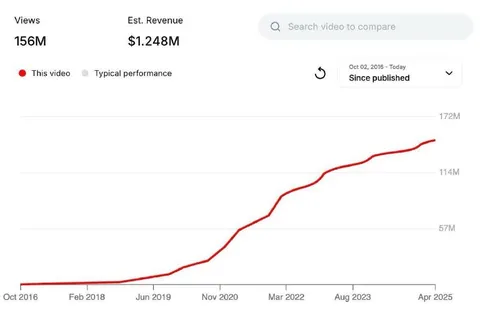
Viral Views Revenue Curve
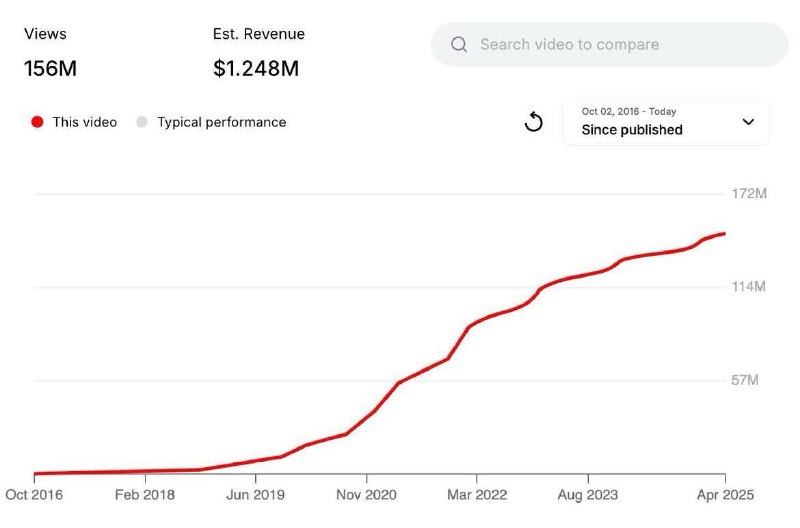
Views 156M Est. Revenue $1.248M Search video to compare This video Typical performance Oct 02, 2016 - Today Since published +72M 114M 57M Oct 2016 Feb 2018 Jun 2019 Nov 2020 Mar 2022 Aug 2023 Apr 2025
A YouTube analytics-style chart shows a video reaching 156 million views and an estimated revenue of $1.248 million, with the red performance line rising sharply over time. The joke is the exaggerated success of a video whose growth appears to accelerate dramatically, making it a reaction image for unexpected virality, huge earnings, or a project suddenly taking off. EN: A YouTube analytics-style chart shows a video reaching 156 million views and an estimated revenue of $1.248 million, with the red performance line rising sharply over time. The joke is the exaggerated success of a video whose growth appears to accelerate dramatically, making it a reaction image for unexpected virality, huge earnings, or a project suddenly taking off.
analytics dashboard / аналитическая панельline chart / линейный графикred trend line / красная линия трендаview counter / счётчик просмотровrevenue figure / показатель доходаsearch bar / строка поискаdate filter / фильтр датыtimeline / временная шкалаgrowth curve / кривая ростаgrid lines / линии сетки
- @gentoomemes / 21624 2026-08-08
- Type
- image
- Size
- 800×528 · 29.0 KiB
- Mood
- triumphant, absurd
- Language
- en
- Added