GitHub Average Uptime Collapse
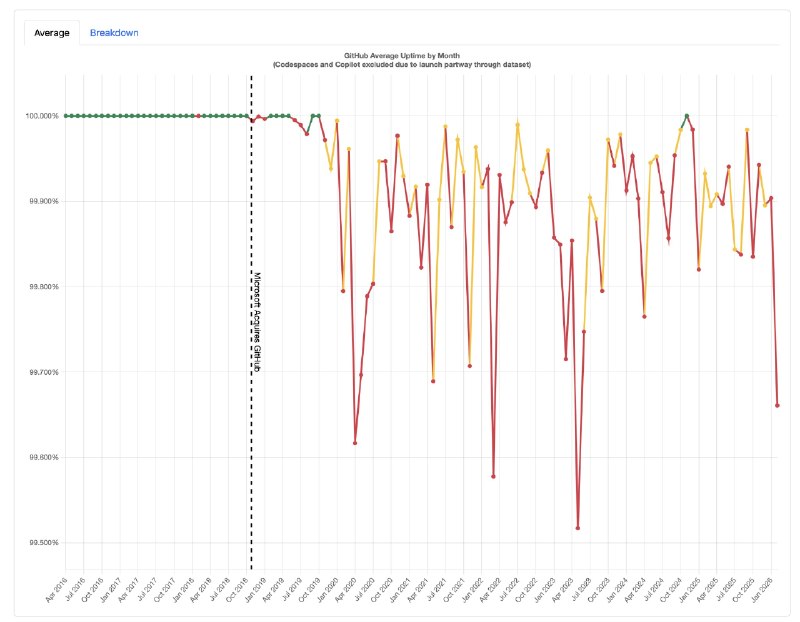
Average Breakdown GitHub Average Uptime by Month (Codespaces and Copilot excluded due to launch pathway through dataset) 100.00% 99.90% 99.80% 99.70% 99.60% 99.50% Microsoft acquires GitHub Apr 2016 Jul 2016 Oct 2016 Jan 2017 Apr 2017 Jul 2017 Oct 2017 Jan 2018 Apr 2018 Jul 2018 Oct 2018 Jan 2019 Apr 2019 Jul 2019 Oct 2019 Jan 2020 Apr 2020 Jul 2020 Oct 2020 Jan 2021 Apr 2021 Jul 2021 Oct 2021 Jan 2022 Apr 2022 Jul 2022 Oct 2022 Jan 2023 Apr 2023 Jul 2023 Oct 2023 Jan 2024 Apr 2024 Jul 2024 Oct 2024 Jan 2025 Apr 2025 Jul 2025 Oct 2025 Jan 2026
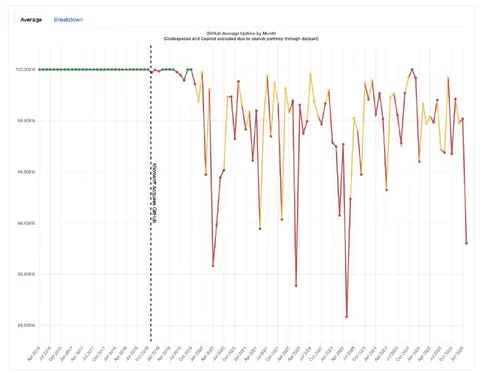
A line chart compares GitHub's average uptime by month, with the line staying nearly perfect before plunging into increasingly dramatic dips. A dashed annotation marks Microsoft's acquisition of GitHub, making the joke that reliability supposedly deteriorated after the acquisition; it is used as a sarcastic reaction to corporate ownership or a service getting worse. EN: A line chart compares GitHub's average uptime by month, with the line staying nearly perfect before plunging into increasingly dramatic dips. A dashed annotation marks Microsoft's acquisition of GitHub, making the joke that reliability supposedly deteriorated after the acquisition; it is used as a sarcastic reaction to corporate ownership or a service getting worse.
line chart / линейный графикuptime graph / график доступностиred data line / красная линия данныхyellow data line / жёлтая линия данныхgreen data line / зелёная линия данныхdashed vertical marker / пунктирная вертикальная отметкаpercentage axis / процентная осьmonth labels / подписи месяцевgrid lines / линии сеткиchart legend tabs / вкладки легенды графикаMicrosoft acquisition annotation / отметка о приобретении Microsoft
- @eternalclassic / 85801 2026-04-02
- Type
- image
- Size
- 800×622 · 62.0 KiB
- Mood
- sarcastic
- Language
- en
- Added