Build System Success Curve
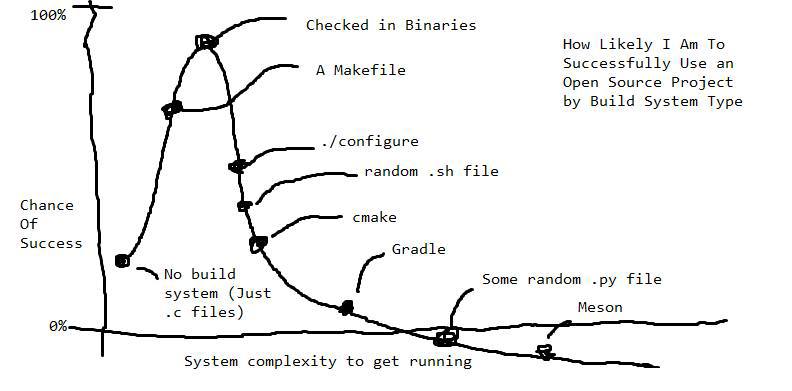
100% Chance Of Success 0% System complexity to get running How Likely I Am To Successfully Use an Open Source Project by Build System Type Checked in Binaries A Makefile ./configure random .sh file cmake Gradle Some random .py file Meson No build system (Just .c files)
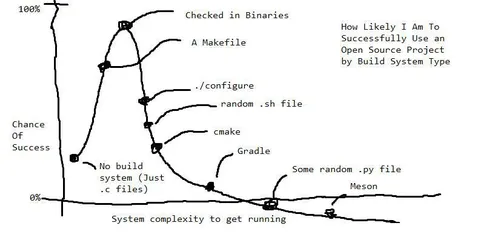
A hand-drawn graph compares the chance of successfully using an open-source project with the complexity of getting it running. Checked-in binaries and simple build methods start with high success, while systems like Gradle, random Python files, and Meson fall toward zero. The joke is that increasingly elaborate or unconventional build systems make open-source software harder to use.
graph / графикline chart / линейный графикaxis labels / подписи осейhandwritten annotations / рукописные подписиblack marker lines / чёрные линии маркераpercentage scale / процентная шкалаbuild system labels / названия систем сборкиcomputer software / компьютерное программное обеспечениеopen-source project / проект с открытым исходным кодомbinary files / бинарные файлыMakefile / Makefileshell script / скрипт оболочкиPython file / файл Pythoncurve / кривая
- @profunctor_io / 9837 2024-02-28
- @ithueti / 11998 2024-02-28
- @gentoomemes / 9742 2024-02-29
- @right_wing_dev_squads / 12167 2025-05-23
- Type
- image
- Size
- 792×391 · 30.2 KiB
- Mood
- саркастичный, абсурдный
- Language
- en
- Added