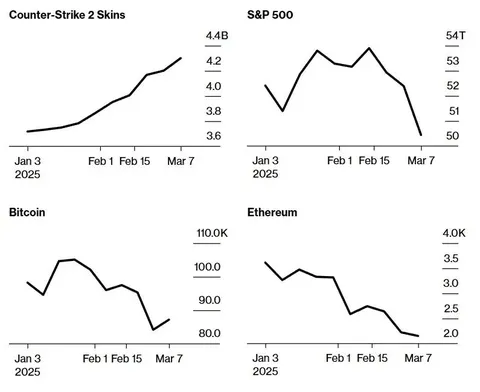
Counter-Strike Skins Keep Going Up
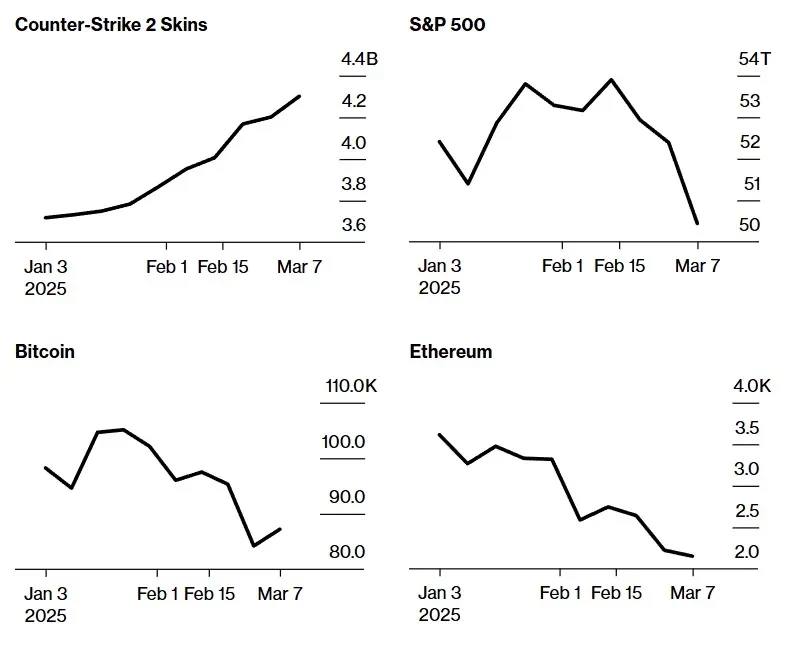
Counter-Strike 2 Skins 4.4B 4.2 4.0 3.8 3.6 Jan 3 2025 Feb 1 Feb 15 Mar 7 S&P 500 54T 53 52 51 50 Jan 3 2025 Feb 1 Feb 15 Mar 7 Bitcoin 110.0K 100.0 90.0 80.0 Jan 3 2025 Feb 1 Feb 15 Mar 7 Ethereum 4.0K 3.5 3.0 2.5 2.0 Jan 3 2025 Feb 1 Feb 15 Mar 7
A four-panel chart compares the rising value of Counter-Strike 2 skins with falling or volatile S&P 500, Bitcoin, and Ethereum prices. The joke is that virtual game cosmetics are outperforming major financial assets, exaggerating the idea that players should invest in skins instead of traditional markets. It is used as a reaction to market crashes, speculative bubbles, or the absurd profitability of gaming items. EN: A four-panel chart compares the rising value of Counter-Strike 2 skins with falling or volatile S&P 500, Bitcoin, and Ethereum prices. The joke is that virtual game cosmetics are outperforming major financial assets, exaggerating the idea that players should invest in skins instead of traditional markets. It is used as a reaction to market crashes, speculative bubbles, or the absurd profitability of gaming items.
- @gentoomemes / 16385 2025-03-11
- @about50posts / 17297 2025-03-14
- @eternalclassic / 66909 2025-03-22
- Type
- image
- Size
- 795×649 · 30.9 KiB
- Mood
- sarcastic, absurd
- Language
- en
- Added