Gold Price Goes to the Moon
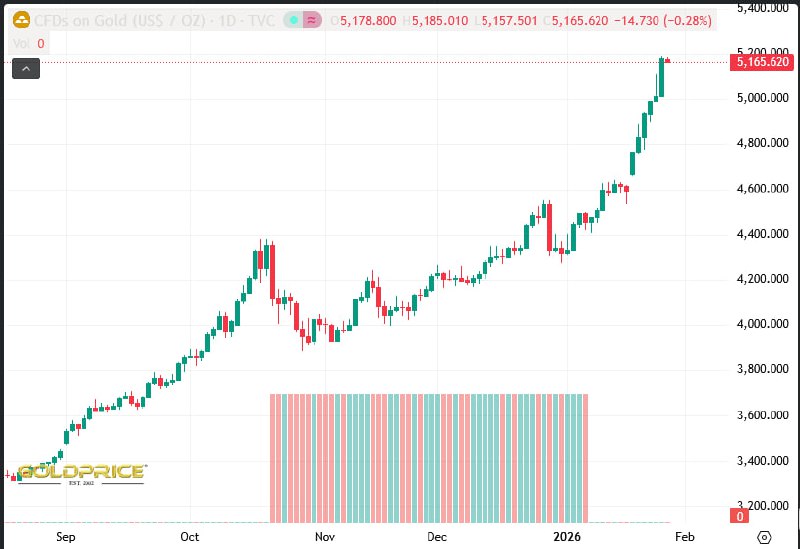
CFDs on Gold (US$ / OZ) · 1D · TVC 5,178.800 5,185.010 5,157.501 5,165.620 -14.730 (-0.28%) Vol 0 Sep Oct Nov Dec 2026 Feb 5,400.000 5,200.000 5,000.000 4,800.000 4,600.000 4,400.000 4,200.000 4,000.000 3,800.000 3,600.000 3,400.000 3,200.000 0 5,165.620
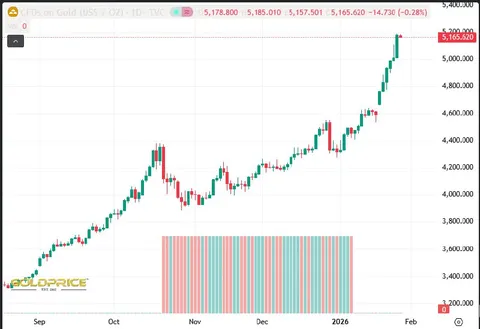
A candlestick chart shows the price of gold rising dramatically over several months, with a steep surge near the end. The joke is that gold is going up so much that donating a Reddit Gold award to an admin feels absurdly expensive or perfectly timed. EN: A candlestick chart shows the price of gold rising dramatically over several months, with a steep surge near the end. The joke is that gold is going up so much that donating a Reddit Gold award to an admin feels absurdly expensive or perfectly timed.
gold price chart / график цены золотаcandlestick chart / свечной графикgreen candlesticks / зелёные свечиred candlesticks / красные свечиrising trend line / восходящий трендprice axis / ценовая шкалаdate axis / ось датvolume bars / столбики объёмаtrading interface / торговый интерфейсwhite chart background / белый фон графика
- @eternalclassic / 82511 2026-01-28
- Type
- image
- Size
- 800×549 · 57.0 KiB
- Mood
- absurd, ironic
- Language
- en
- Added