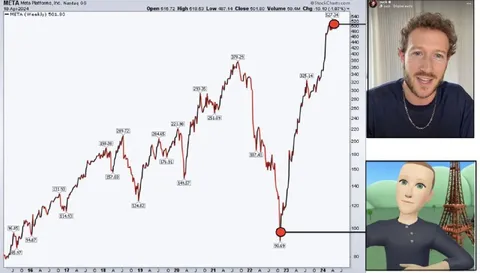
Meta Stock Chart Rollercoaster
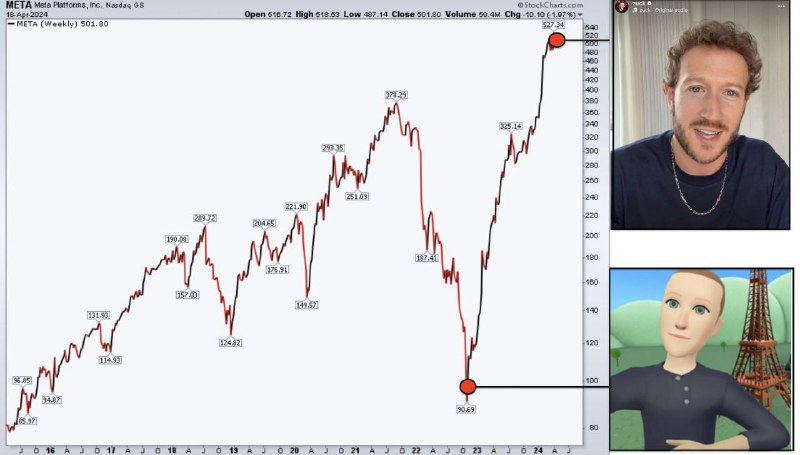
META Meta Platforms, Inc. Nasdaq GS 18-Apr-2024 Open 516.72 High 618.53 Low 487.14 Close 501.80 Volume 50.4M Chg -10.9 (-2.07%) META (Weekly) 501.80
A Meta stock price chart rises and falls dramatically, with Mark Zuckerberg above a Mii-style avatar in front of the Eiffel Tower on the right. The joke contrasts the volatile company stock chart with two awkward-looking representations of Zuckerberg, making it a reaction to chaotic ups and downs or a disastrous situation. EN: A Meta stock price chart rises and falls dramatically, with Mark Zuckerberg above a Mii-style avatar in front of the Eiffel Tower on the right. The joke contrasts the volatile company stock chart with two awkward-looking representations of Zuckerberg, making it a reaction to chaotic ups and downs or a disastrous situation.
stock chart / график акцийline graph / линейный графикred and black price line / красная и чёрная линия ценыman in a dark shirt / мужчина в тёмной рубашкеchain necklace / цепочка на шееMii-style avatar / аватар в стиле MiiEiffel Tower / Эйфелева башняblue sky / голубое небоgreen hills / зелёные холмыcomputer screen / экран компьютера
- @gentoomemes / 10890 2024-04-25
- Type
- image
- Size
- 800×455 · 51.4 KiB
- Mood
- absurd, sarcastic
- Language
- en
- Added