Real Designers Made This Dashboard
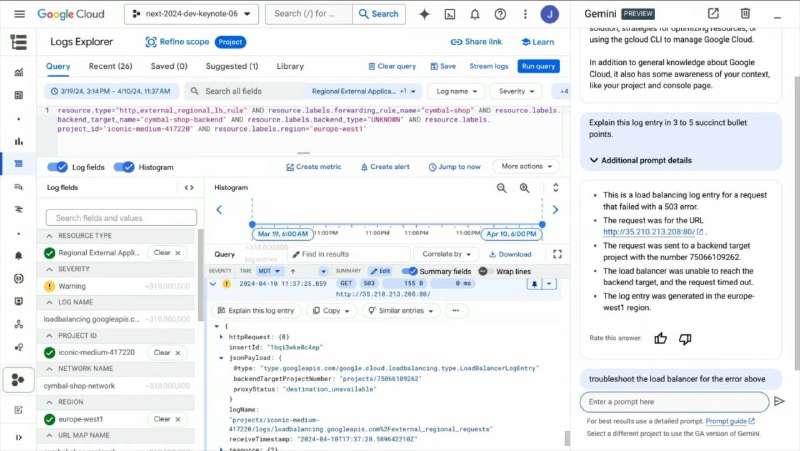
Explain this log entry in 3 to 5 succinct bullet points. Additional prompt details This is a load balancing log entry for a request that failed with a 503 error. The request was to the URL http://35.210.213.208/ The request was sent to a backend target project with the number 75066109262. The load balancer was unable to reach the backend target, and the request timed out. The log entry was generated in the europe-west1 region. troubleshoot the load balancer for the error above
A screenshot shows the Google Cloud Logs Explorer dashboard alongside a Gemini panel explaining a failed load-balancer request. The joke is that the cluttered, overly complicated dashboard was supposedly created by real designers, while the AI is asked to explain its confusing output in bullet points. It is used as a reaction to bad enterprise UI and absurdly complex developer tools.
cloud dashboard / облачная панельweb browser window / окно веб-браузераGoogle Cloud logo / логотип Google Cloudlogs explorer interface / интерфейс Logs Explorerline chart / линейный графикhistogram / гистограммаlog entry / запись журналаsidebar / боковая панельsearch bar / строка поискаblue buttons / синие кнопкиGemini chat panel / панель чата Geminitext prompt / текстовый запросnetwork diagram icon / значок сетевой диаграммыerror message / сообщение об ошибкеcomputer screen / экран компьютера
- @gentoomemes / 10854 2024-04-23
- Type
- image
- Size
- 800×451 · 83.4 KiB
- Mood
- sarcastic, absurd
- Language
- en
- Added