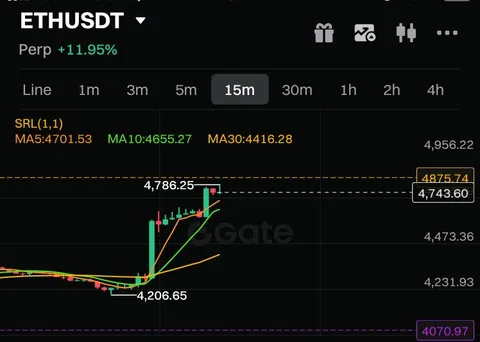
ETHUSDT 125x Pump
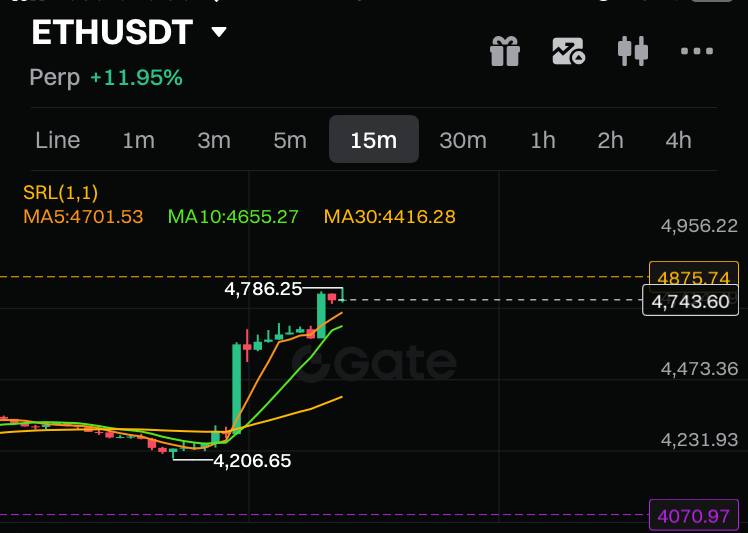
ETHUSDT Perp +11.95% Line 1m 3m 5m 15m 30m 1h 2h 4h SRL(1,1) MA5:4701.53 MA10:4655.27 MA30:4416.28 4,956.22 4875.74 4,786.25 4,743.60 4,473.36 4,231.93 4,206.65 4070.97
A dark cryptocurrency trading chart shows ETHUSDT on a 15-minute timeframe surging sharply upward, with the price up 11.95% and several moving-average lines visible. The uploader’s caption, “imagine leveraging this at 125x,” jokes about using extreme leverage during the pump, implying enormous potential profits alongside the obvious risk of instant liquidation. It is used as a reaction to a dramatic crypto price move or reckless trading opportunity.
cryptocurrency price chart / график цены криптовалютыEthereum trading pair / торговая пара Ethereumcandlestick chart / свечной графикgreen candlesticks / зелёные свечиred candlesticks / красные свечиmoving-average lines / линии скользящих среднихprice axis / шкала ценыtimeframe selector / выбор таймфрейма15-minute interval / 15-минутный интервалtrading interface / интерфейс торговлиupward price spike / резкий скачок цены вверхdark background / тёмный фон
- @eternalclassic / 74575 2025-08-22
- Type
- image
- Size
- 748×533 · 33.5 KiB
- Mood
- excited, reckless
- Language
- en
- Added