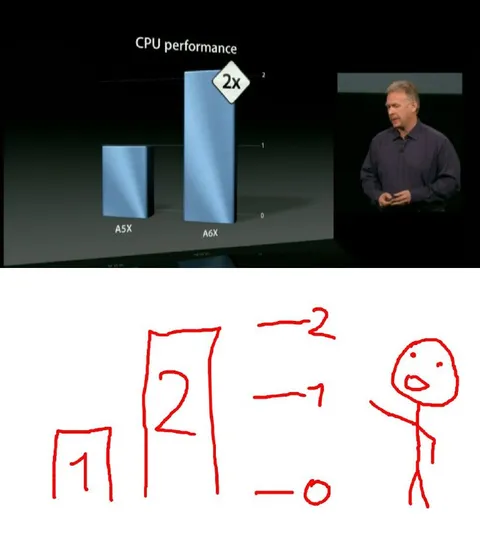
CPU Performance Graph Comparison
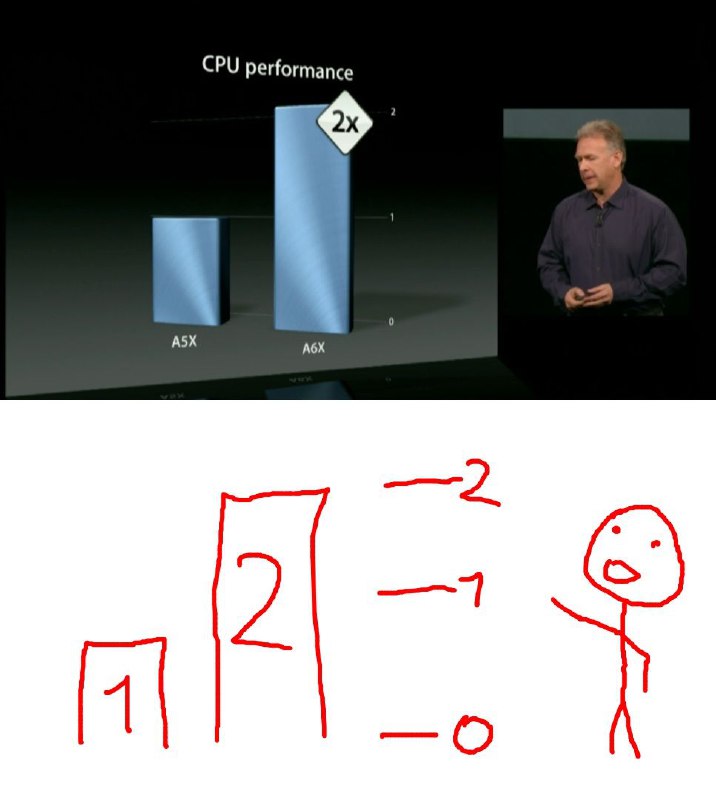
CPU performance 2x A5X A6X 2 1 0 2 -2 -1 -0
A presentation slide compares the CPU performance of the A5X and A6X chips, showing the A6X at twice the performance. Below it, a crude hand-drawn version exaggerates the graph into a tall bar labeled 2, mocking misleading or overly dramatic performance comparisons. It is used as a reaction to inflated benchmarks or claims that something is twice as good. EN: A presentation slide compares the CPU performance of the A5X and A6X chips, showing the A6X at twice the performance. Below it, a crude hand-drawn version exaggerates the graph into a tall bar labeled 2, mocking misleading or overly dramatic performance comparisons. It is used as a reaction to inflated benchmarks or claims that something is twice as good.
presentation slide / слайд презентацииbar chart / столбчатая диаграммаblue bars / синие столбцыCPU performance graph / график производительности процессораspeaker on stage / выступающий на сценеdark stage / тёмная сценаhand-drawn graph / нарисованный от руки графикstick figure / человечек-палочкаred marker lines / красные линии маркераnumbers and labels / числа и подписи
- @gentoomemes / 6062 2023-08-28
- @ithueti / 10184 2023-08-28
- Type
- image
- Size
- 716×800 · 43.7 KiB
- Mood
- sarcastic, absurd
- Language
- en
- Added