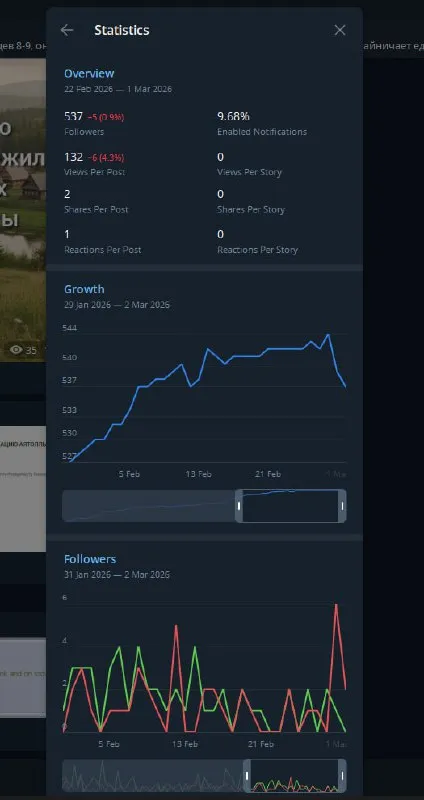
Telegram Channel Statistics Drop
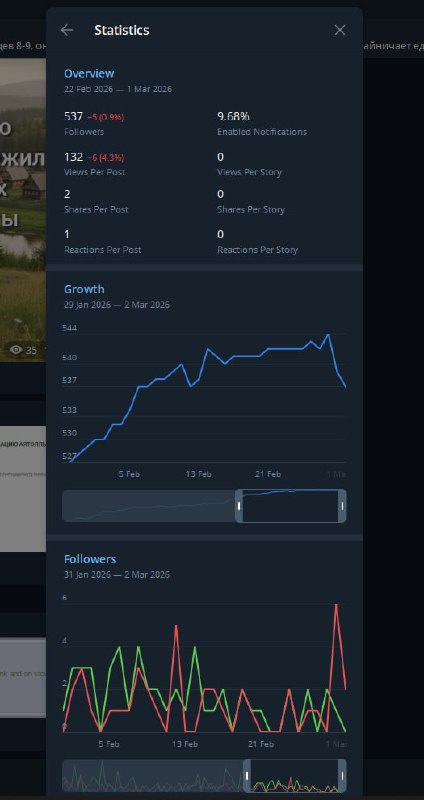
Statistics Overview 22 Feb 2026 — 1 Mar 2026 537 -5 (0.9%) 9.68% Followers 137 -6 (4.3%) Enabled Notifications 132 0 Views Per Post Views Per Story 2 0 Shares Per Post Shares Per Story 1 0 Reactions Per Post Reactions Per Story Growth 29 Jan 2026 — 2 Mar 2026 544 540 537 533 530 527 5 Feb 13 Feb 21 Feb 1 Mar Followers 31 Jan 2026 — 2 Mar 2025 6 4 2
A Telegram statistics screen shows a channel losing followers, with a downward turn at the end of the growth chart and volatile follower fluctuations below. The joke is the bleakly comic presentation of audience decline as a set of official-looking analytics, fitting reactions to unsubscribes, poor engagement, or a channel having a bad day. EN: A Telegram statistics screen shows a channel losing followers, with a downward turn at the end of the growth chart and volatile follower fluctuations below. The joke is the bleakly comic presentation of audience decline as a set of official-looking analytics, fitting reactions to unsubscribes, poor engagement, or a channel having a bad day.
smartphone screenshot / скриншот смартфонаTelegram statistics panel / панель статистики Telegramdark interface / тёмный интерфейсline chart / линейный графикbar chart / столбчатый графикfollower count / количество подписчиковdownward graph line / нисходящая линия графикаred chart line / красная линия графикаgreen chart line / зелёная линия графикаblue chart line / синяя линия графикаdate labels / подписи датnotification metric / показатель уведомлений
- @deenya_md / 24005 2026-03-03
- Type
- image
- Size
- 424×800 · 38.8 KiB
- Mood
- саркастичный, мрачный
- Language
- en
- Added