Solar Cycle Explains US Intervention
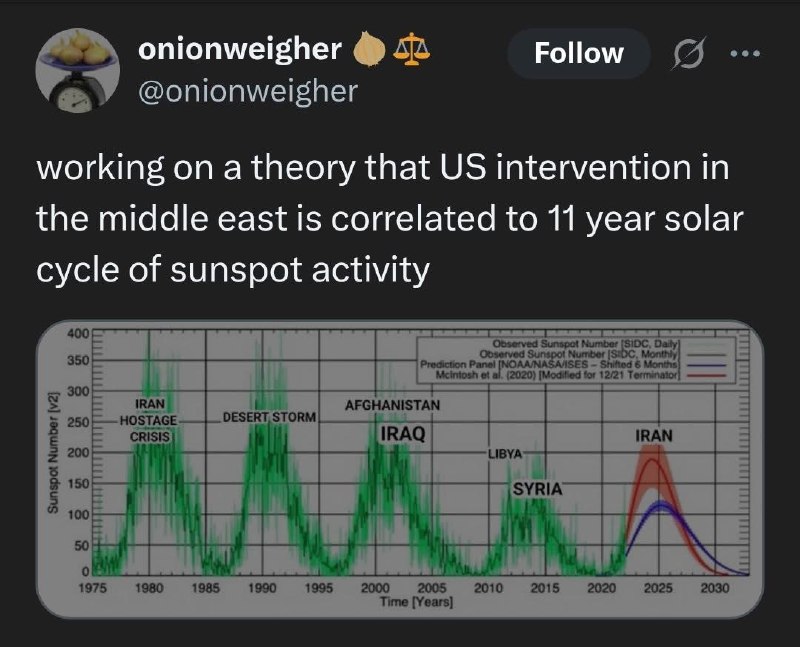
working on a theory that US intervention in the middle east is correlated to 11 year solar cycle of sunspot activity Observed Sunspot Number (SIDC, Daily) Observed Sunspot Number (SIDC, Monthly) Prediction Panel (NOAA/NASA/ISES — Shifted 6 Months) Mitchon et al. (2020) [Modified for 12/21 Terminator] IRAN HOSTAGE CRISIS DESERT STORM AFGHANISTAN IRAQ LIBYA SYRIA IRAN Sunspot Number [v2] Time [Years]
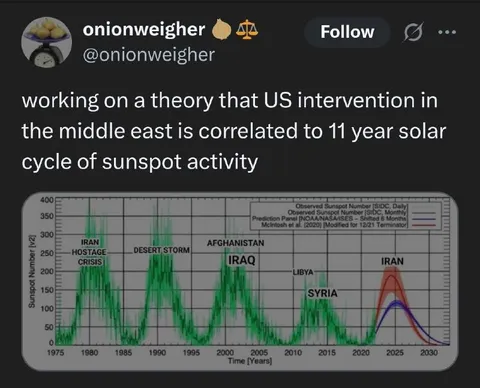
A screenshot of a social media post presents a chart of sunspot activity from 1975 to 2030, with major US military interventions and Middle Eastern conflicts labeled over the peaks. The joke is a mock-serious conspiracy theory claiming that US intervention in the Middle East follows the sunspot cycle, treating a coincidental correlation as causation. It is used as an absurd reaction to geopolitical analysis, conspiracy theories, or overconfident pattern-finding. EN: A screenshot of a social media post presents a chart of sunspot activity from 1975 to 2030, with major US military interventions and Middle Eastern conflicts labeled over the peaks. The joke is a mock-serious conspiracy theory claiming that US intervention in the Middle East follows the sunspot cycle, treating a coincidental correlation as causation. It is used as an absurd reaction to geopolitical analysis, conspiracy theories, or overconfident pattern-finding.
- @eternalclassic / 71646 2025-06-25
- Type
- image
- Size
- 800×647 · 82.7 KiB
- Mood
- absurd, satirical
- Language
- en
- Added