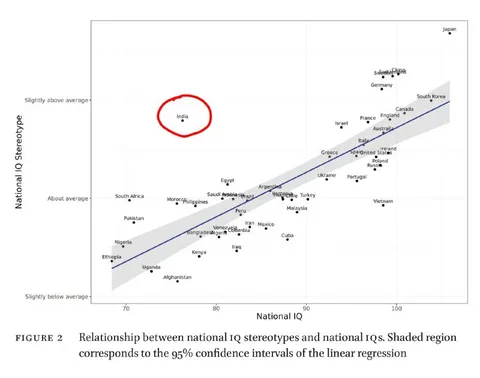
India IQ Outlier Chart
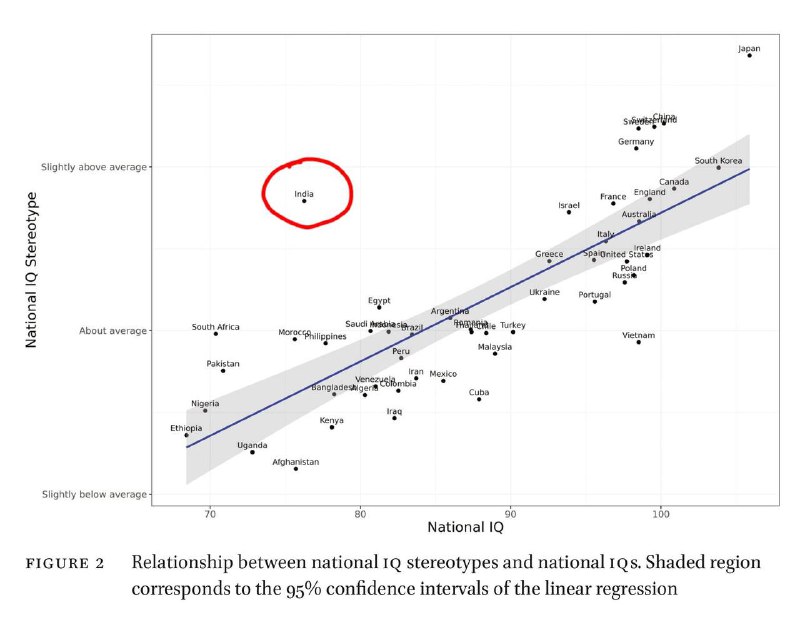
Slightly above average National IQ Stereotype About average Slightly below average Japan China South Korea Switzerland Sweden Germany Canada France England Australia Israel Greece Italy Spain Ireland United States Poland Russia Portugal Vietnam Ukraine Turkey Malaysia South Africa Morocco Philippines Pakistan Nigeria Ethiopia Uganda Afghanistan Kenya Bangladesh India Egypt Saudi Arabia Indonesia Brazil Argentina Peru Iran Mexico Venezuela Colombia Cuba Iraq FIGURE 2 Relationship between national IQ stereotypes and national IQs. Shaded region corresponds to the 95% confidence intervals of the linear regression National IQ 70 80 90 100
A scatter plot compares national IQ stereotypes with national IQ scores, with countries positioned along a regression line. India is circled in red as a conspicuous outlier above the trend, making the chart function as a reaction meme about an exaggerated national stereotype or an unexpected exception. It is typically shared sarcastically when someone wants to highlight a surprising outlier or mock dubious IQ-based generalizations.
scatter plot / точечная диаграммаgraph axes / оси графикаred circle / красный кругregression line / линия регрессииgray confidence interval / серый доверительный интервалcountry labels / подписи странIndia data point / точка данных Индииwhite chart background / белый фон графикаfigure caption / подпись к рисунку
- @eternalclassic / 68909 2025-05-01
- Type
- image
- Size
- 800×630 · 52.1 KiB
- Mood
- sarcastic, absurd
- Language
- en
- Added