Bitcoin Crashes While Dancing
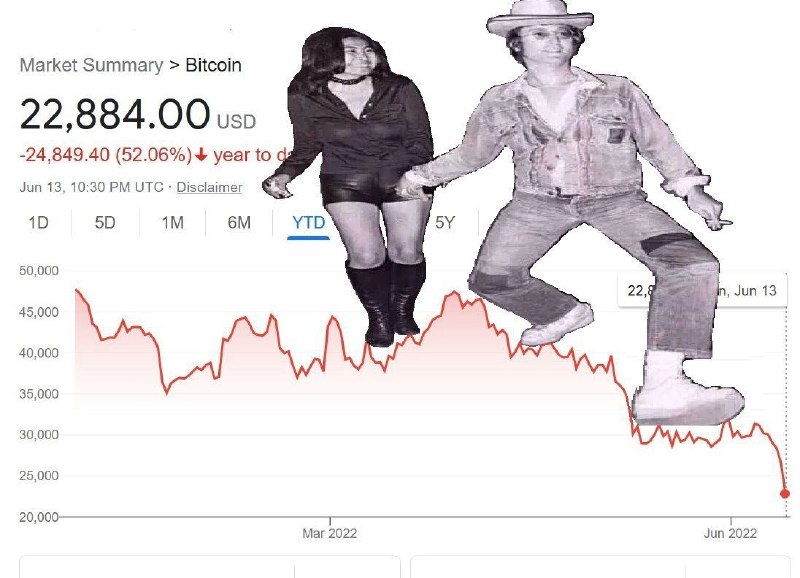
Market Summary > Bitcoin 22,884.00 USD -24,849.40 (52.06%) ↓ year to date Jun 13, 10:30 PM UTC · Disclaimer 1D 5D 1M 6M YTD 5Y 50,000 45,000 40,000 35,000 30,000 25,000 20,000 Mar 2022 Jun 2022 22,884.00 on Jun 13
A Bitcoin price chart shows a steep decline, with two dancing figures superimposed over the graph as if celebrating the crash. The joke is that the market is collapsing while the dancers remain cheerfully unbothered, making it a reaction image for crypto losses, financial disaster, or ironic celebration. EN: A Bitcoin price chart shows a steep decline, with two dancing figures superimposed over the graph as if celebrating the crash. The joke is that the market is collapsing while the dancers remain cheerfully unbothered, making it a reaction image for crypto losses, financial disaster, or ironic celebration.
Bitcoin price chart / график цены биткоинаred falling line / красная падающая линияdancing woman in black / танцующая женщина в чёрномdancing man in cowboy hat / танцующий мужчина в ковбойской шляпеblack boots / чёрные сапогиcowboy hat / ковбойская шляпаdenim shirt / джинсовая рубашкаjeans / джинсыprice labels / обозначения ценchart tooltip / всплывающая подсказка графикаwhite background / белый фон
- @dustinthehead / 7613 2022-06-22
- Type
- image
- Size
- 800×578 · 76.5 KiB
- Mood
- absurd, ironic
- Language
- en
- Added