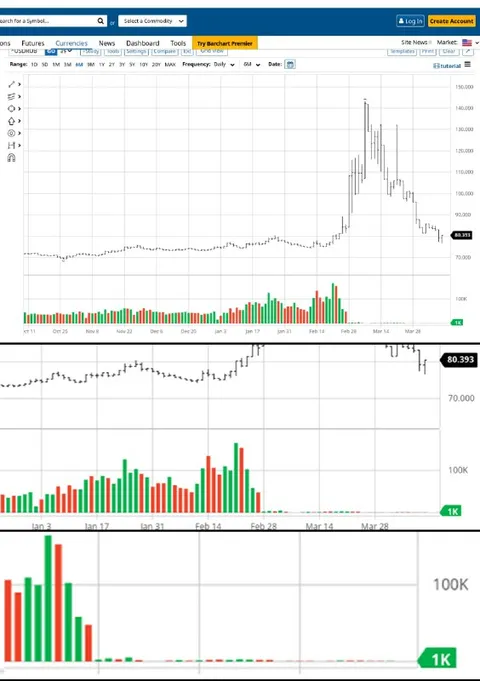
Chart Crash After the Spike
Search for a Symbol... Select a Commodity Log In Create Account Futures Currencies News Dashboard Tools Try Barchart Premier Range: 1D 5D 1M 3M 6M 9M 1Y 2Y 5Y 10Y 20Y MAX Frequency: Daily Date: 80.393 70.000 100K 1K Oct 11 Oct 25 Nov 8 Nov 22 Dec 6 Dec 20 Jan 3 Jan 17 Jan 31 Feb 14 Feb 28 Mar 14 Mar 28 80.393 70.000 100K 1K Jan 3 Jan 17 Jan 31 Feb 14 Feb 28 Mar 14 Mar 28 100K 1K
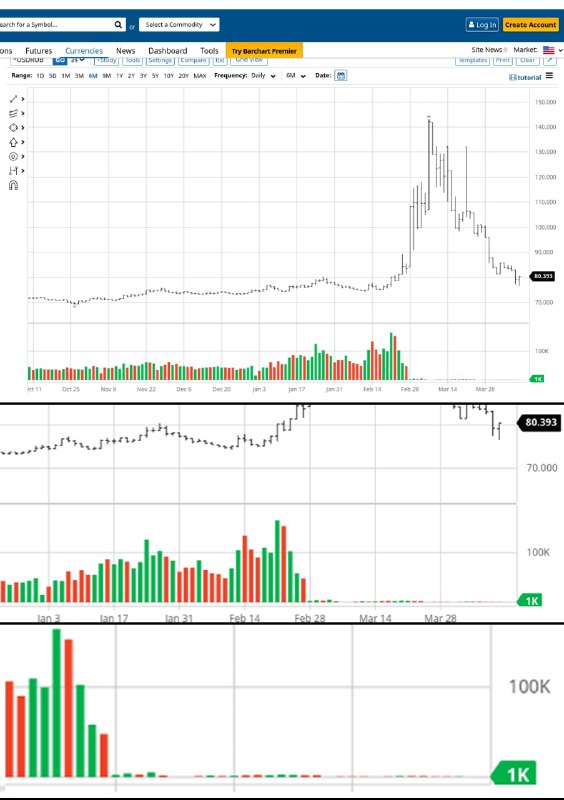
A financial chart shows a long period of relatively stable movement, followed by a dramatic spike and a steep collapse back toward its earlier level. The joke is the painfully familiar boom-and-bust pattern, making it useful as a reaction to sudden success followed by an even faster failure. EN: A financial chart shows a long period of relatively stable movement, followed by a dramatic spike and a steep collapse back toward its earlier level. The joke is the painfully familiar boom-and-bust pattern, making it useful as a reaction to sudden success followed by an even faster failure.
financial chart / финансовый графикline graph / линейный графикcandlesticks / свечиgreen volume bars / зелёные столбцы объёмаred volume bars / красные столбцы объёмаprice spike / скачок ценыsharp decline / резкое падениеaxis labels / подписи осейdate labels / подписи датwebsite interface / интерфейс сайтаsearch bar / строка поиска
- @dustinthehead / 6441 2022-05-04
- Type
- image
- Size
- 564×800 · 64.5 KiB
- Mood
- absurd
- Language
- en
- Added