Демография Лондона по районам
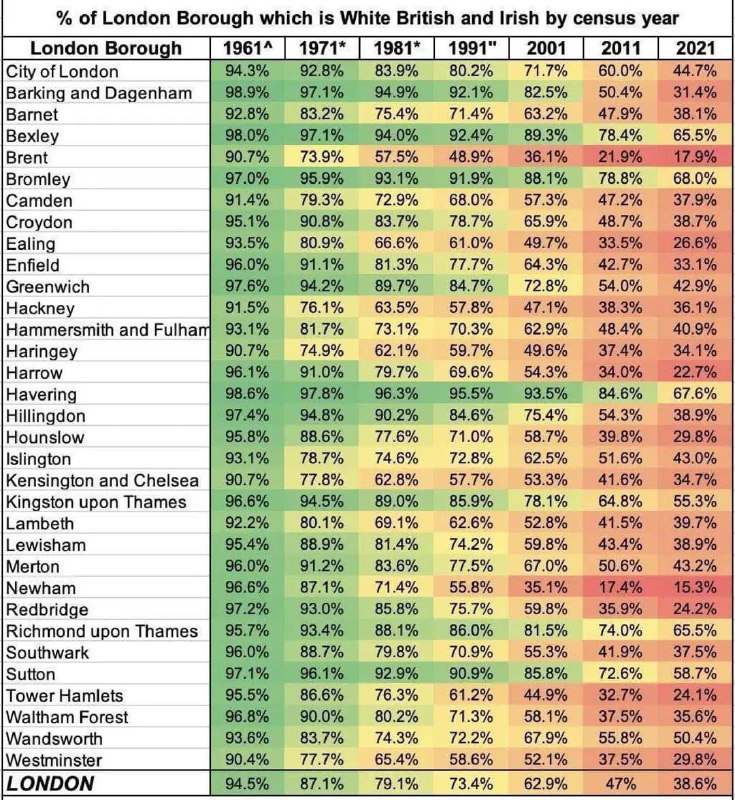
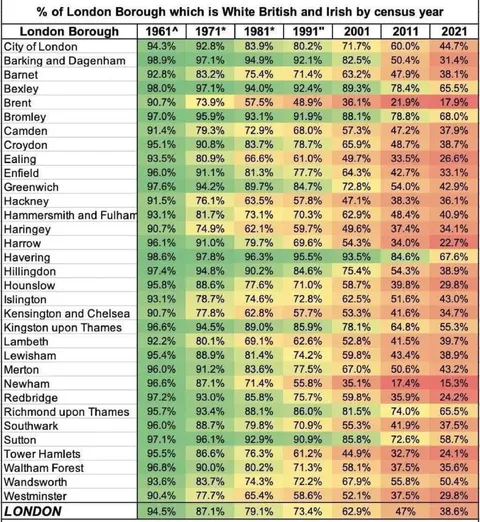
% of London Borough which is White British and Irish by census year London Borough | 1961^ | 1971* | 1981* | 1991" | 2001 | 2011 | 2021 City of London | 94.3% | 92.8% | 83.9% | 80.2% | 71.7% | 60.0% | 44.7% Barking and Dagenham | 98.9% | 97.1% | 94.9% | 92.1% | 82.5% | 50.4% | 31.4% Barnet | 92.8% | 83.2% | 75.4% | 71.4% | 63.2% | 47.9% | 38.1% Bexley | 98.0% | 97.1% | 94.0% | 92.4% | 89.3% | 78.4% | 65.5% Brent | 90.7% | 73.9% | 57.5% | 48.9% | 36.1% | 21.9% | 17.9% Bromley | 97.0% | 95.9% | 93.1% | 91.9% | 88.1% | 78.8% | 68.0% Camden | 91.4% | 79.3% | 72.9% | 68.0% | 57.3% | 47.2% | 37.9% Croydon | 95.1% | 90.8% | 83.7% | 78.7% | 65.9% | 48.7% | 38.7% Ealing | 93.5% | 80.9% | 66.6% | 61.0% | 49.7% | 33.5% | 26.6% Enfield | 96.0% | 91.1% | 81.3% | 77.7% | 64.3% | 42.7% | 33.1% Greenwich | 97.6% | 94.2% | 89.7% | 84.7% | 72.8% | 54.0% | 42.9% Hackney | 91.5% | 76.1% | 63.5% | 57.8% | 47.1% | 38.3% | 36.1% Hammersmith and Fulham | 93.1% | 81.7% | 73.1% | 70.3% | 62.9% | 48.4% | 40.9% Haringey | 90.7% | 74.9% | 62.1% | 59.7% | 49.6% | 37.4% | 34.1% Harrow | 96.1% | 91.0% | 79.7% | 69.6% | 54.3% | 34.0% | 22.7% Havering | 98.6% | 97.8% | 96.3% | 95.5% | 93.5% | 84.6% | 67.6% Hillingdon | 97.4% | 94.8% | 90.2% | 84.6% | 75.4% | 54.3% | 38.9% Hounslow | 95.8% | 88.6% | 77.6% | 71.0% | 58.7% | 39.8% | 29.8% Islington | 93.1% | 78.7% | 74.6% | 72.8% | 62.5% | 51.6% | 43.0% Kensington and Chelsea | 90.7% | 77.8% | 62.8% | 57.7% | 53.3% | 41.6% | 34.7% Kingston upon Thames | 96.6% | 94.5% | 89.0% | 85.9% | 78.1% | 64.8% | 55.3% Lambeth | 92.2% | 80.1% | 69.1% | 62.6% | 52.8% | 41.5% | 39.7% Lewisham | 95.4% | 88.9% | 81.4% | 74.2% | 59.8% | 43.4% | 38.9% Merton | 96.0% | 91.2% | 83.6% | 77.5% | 67.0% | 50.6% | 43.2% Newham | 96.6% | 87.1% | 71.4% | 55.8% | 35.1% | 17.4% | 15.3% Redbridge | 97.2% | 93.0% | 85.8% | 75.7% | 59.8% | 35.9% | 24.2% Richmond upon Thames | 95.7% | 93.4% | 88.1% | 86.0% | 81.5% | 74.0% | 65.5% Southwark | 96.0% | 88.7% | 79.8% | 70.9% | 55.3% | 41.9% | 37.5% Sutton | 97.1% | 96.1% | 92.9% | 90.9% | 85.8% | 72.6% | 58.7% Tower Hamlets | 95.5% | 86.6% | 76.3% | 61.2% | 44.9% | 32.7% | 24.1% Waltham Forest | 96.8% | 90.0% | 80.2% | 71.3% | 58.1% | 37.5% | 35.6% Wandsworth | 93.6% | 83.7% | 74.3% | 72.2% | 67.9% | 55.8% | 50.4% Westminster | 90.4% | 77.7% | 65.4% | 58.6% | 52.1% | 37.5% | 29.8% LONDON | 94.5% | 87.1% | 79.1% | 73.4% | 62.9% | 47% | 38.6%
A table shows the percentage of residents identifying as White British and Irish across London boroughs from 1961 to 2021. The uploader’s Russian caption jokes that a Sherlock series set in an earlier England portrays the era accurately because there are supposedly no “Muhammads” in the cast, using the demographic decline shown in the table as a sarcastic reaction to perceived historical diversity. EN: A table shows the percentage of residents identifying as White British and Irish across London boroughs from 1961 to 2021. The uploader’s Russian caption jokes that a Sherlock series set in an earlier England portrays the era accurately because there are supposedly no “Muhammads” in the cast, using the demographic decline shown in the table as a sarcastic reaction to perceived historical diversity.
- @sbunem / 92812 2025-01-14
- Type
- image
- Size
- 735×800 · 205.5 KiB
- Mood
- саркастичный, провокационный
- Language
- en
- Added