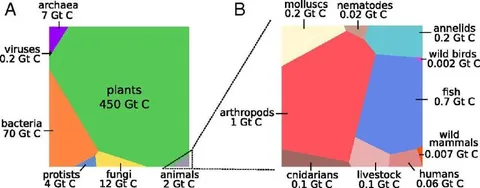
Earth's Biomass by Kingdom
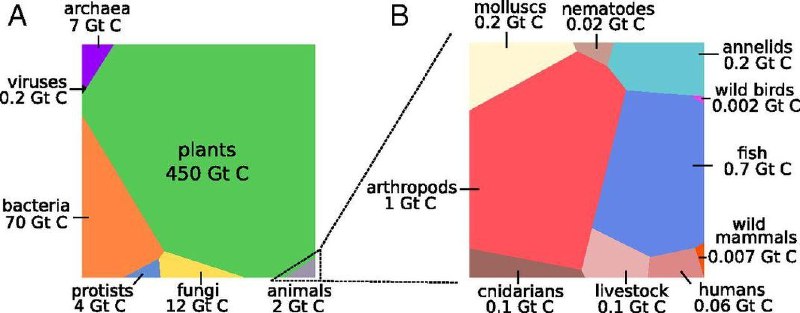
A archaea 7 Gt C viruses 0.2 Gt C bacteria 70 Gt C protists 4 Gt C fungi 12 Gt C plants 450 Gt C animals 2 Gt C B molluscs 0.2 Gt C nematodes 0.02 Gt C annelids 0.2 Gt C wild birds 0.002 Gt C fish 0.7 Gt C wild mammals 0.007 Gt C arthropods 1 Gt C cnidarians 0.1 Gt C livestock 0.1 Gt C humans 0.06 Gt C
Two pie charts compare the carbon biomass of major groups on Earth. Plants dominate the total biomass, while humans occupy a tiny slice; the joke is that humanity feels important despite being vastly outnumbered and outweighed by microbes, fungi, animals, and other life. EN: Two pie charts compare the carbon biomass of major groups on Earth. Plants dominate the total biomass, while humans occupy a tiny slice; the joke is that humanity feels important despite being vastly outnumbered and outweighed by microbes, fungi, animals, and other life.
biomass pie chart / круговая диаграмма биомассыgreen plant sector / зелёный сектор растенийorange bacteria sector / оранжевый сектор бактерийred molluscs sector / красный сектор моллюсковblue fish sector / синий сектор рыбsmall human sector / маленький сектор людейchart labels / подписи диаграммыdotted connector line / пунктирная соединительная линия
- @dustinthehead / 2894 2021-05-06
- Type
- image
- Size
- 800×313 · 43.1 KiB
- Mood
- ironic, absurd
- Language
- en
- Added