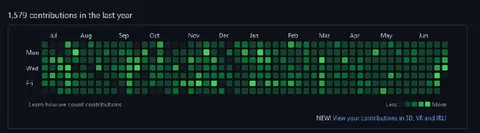
1,579 Contributions in One Year
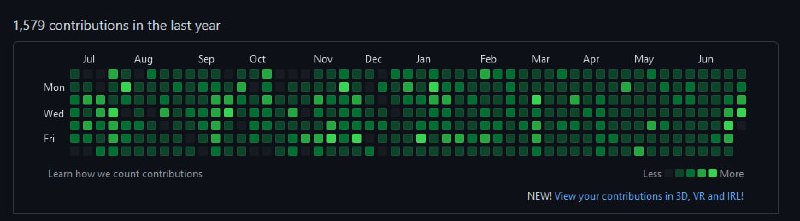
1,579 contributions in the last year Jul Aug Sep Oct Nov Dec Jan Feb Mar Apr May Jun Mon Wed Fri Learn how we count contributions Less More NEW! View your contributions in 3D, VR and IRL!
A GitHub contribution graph shows 1,579 contributions over the last year, with activity spread across nearly every month. The joke is that the uploader has no chill because they are constantly contributing, even humorously claiming to do so in 3D, VR, and real life. EN: A GitHub contribution graph shows 1,579 contributions over the last year, with activity spread across nearly every month. The joke is that the uploader has no chill because they are constantly contributing, even humorously claiming to do so in 3D, VR, and real life.
- @eternalclassic / 15625 2022-06-30
- Template
- GitHub contribution graph
- Type
- image
- Size
- 800×221 · 35.0 KiB
- Mood
- достижительный, ироничный
- Language
- en
- Added