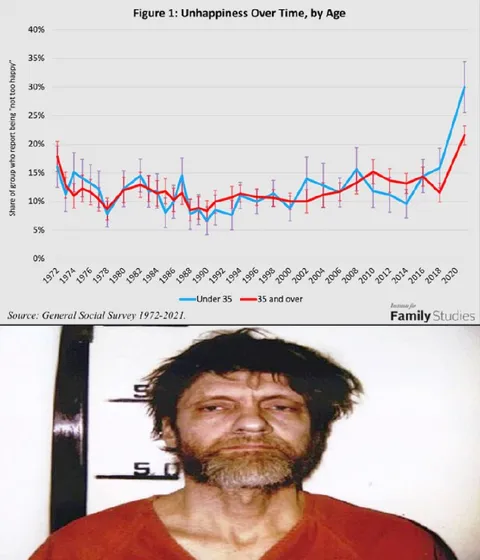
Unhappiness Over Time by Age
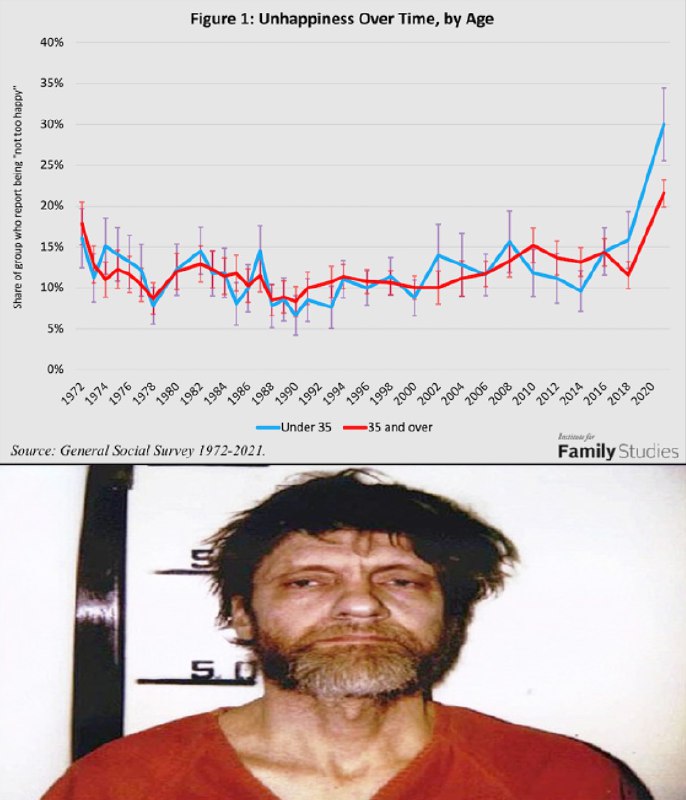
Figure 1: Unhappiness Over Time, by Age 40% 35% 30% 25% 20% 15% 10% 5% 0% Share of Group who report being “not too happy” 1972 1974 1976 1978 1980 1982 1984 1986 1988 1990 1992 1994 1996 1998 2000 2002 2004 2006 2008 2010 2012 2014 2016 2018 2020 Under 35 35 and over Source: General Social Survey 1972-2021. Institute for Family Studies
A graph titled “Figure 1: Unhappiness Over Time, by Age” shows reported unhappiness among people under 35 and those 35 and over from 1972 to 2021, with a sharp rise near 2020. Below it is a mugshot of a disheveled, bearded man looking exhausted and unhappy. The joke is that the grim-looking man visually represents the sudden increase in unhappiness shown by the chart, making the data feel like a reaction image. EN: A graph titled “Figure 1: Unhappiness Over Time, by Age” shows reported unhappiness among people under 35 and those 35 and over from 1972 to 2021, with a sharp rise near 2020. Below it is a mugshot of a disheveled, bearded man looking exhausted and unhappy. The joke is that the grim-looking man visually represents the sudden increase in unhappiness shown by the chart, making the data feel like a reaction image.
- @eternalclassic / 15622 2022-06-30
- Type
- image
- Size
- 686×800 · 76.4 KiB
- Mood
- grim, ironic
- Language
- en
- Added