Bayes Theorem Visual Representation
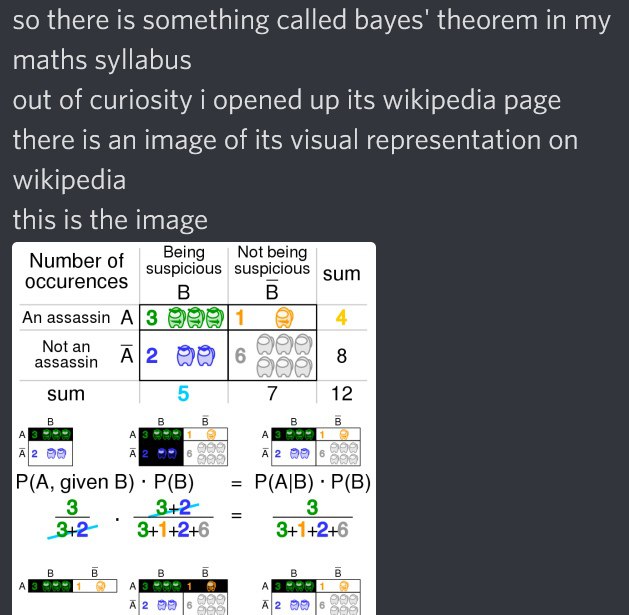
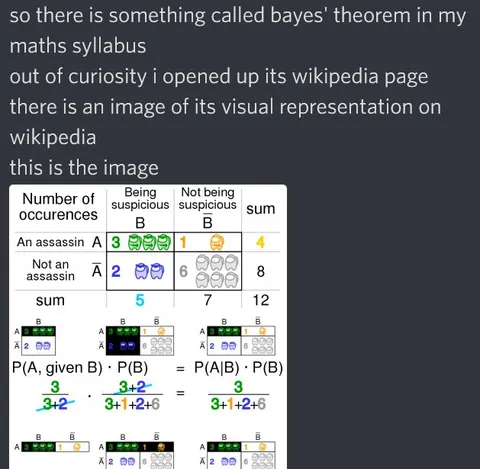
so there is something called bayes' theorem in my maths syllabus out of curiosity i opened up its wikipedia page there is an image of its visual representation on wikipedia this is the image Number of occurrences Being suspicious Not being suspicious sum An assassin A A̅ 3 1 4 Not an assassin 2 6 8 sum 5 7 12 P(A, given B) · P(B) = P(A|B) · P(B) 3/(3+2) · (3+2)/(3+1+2+6) = (3+1+2+6)/(3+1+2+6)
Короткий пост с юмором показывает изображение визуального представления теоремы Байеса из Википедии: таблицу с подозрительными и неподозрительными убийцами, цветными человечками и формулой вероятности. Шутка в том, что сложная математическая теорема представлена неожиданно абсурдной и перегруженной схемой, поэтому картинку отправляют как реакцию на запутанную математику или чрезмерно усложнённое объяснение. EN: A short humorous post shows an image of the visual representation of Bayes' theorem from Wikipedia: a table of suspicious and non-suspicious assassins, colorful little figures, and a probability formula. The joke is that a complex mathematical theorem is presented as an unexpectedly absurd and overloaded diagram, so the image is shared as a reaction to confusing mathematics or an unnecessarily complicated explanation.
- @eternalclassic / 14014 2022-05-22
- Type
- image
- Size
- 629×615 · 63.5 KiB
- Mood
- absurd, confused
- Language
- en
- Added