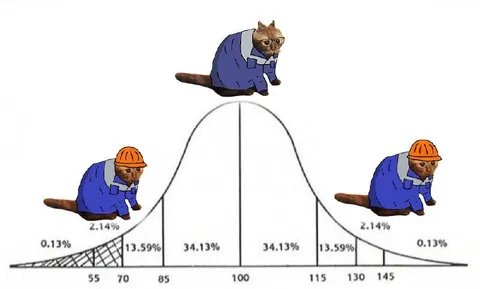
Кривая нормального распределения котов
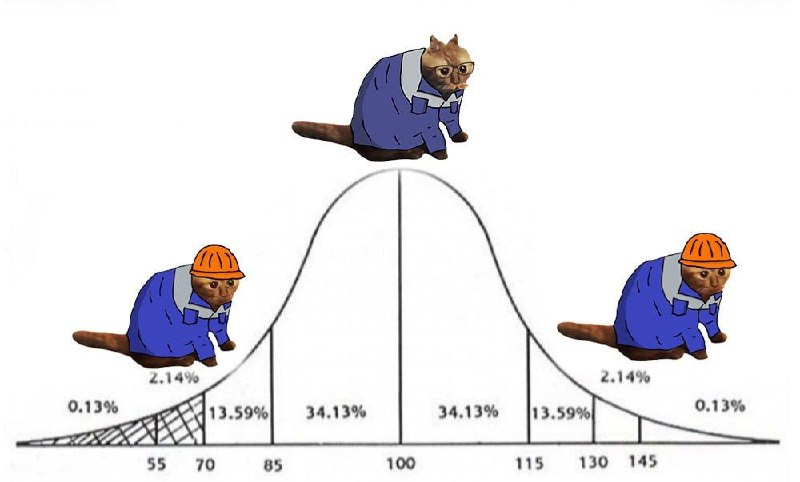
0.13% 2.14% 13.59% 34.13% 34.13% 13.59% 2.14% 0.13% 55 70 85 100 115 130 145
На графике нормального распределения три одинаковых кота в синих костюмах по-разному представлены на шкале: крайние коты носят оранжевые каски, а центральный кот выглядит как руководитель. Шутка построена на шаблоне «колокол Белла», где крайние значения неожиданно изображены одинаково, а среднее значение выглядит наиболее солидно; мем используют для ироничного сравнения уровней интеллекта или компетентности. EN: A normal distribution graph shows three identical cats in blue suits represented differently across the scale: the cats at the extremes wear orange hard hats, while the central cat looks like an executive. The joke uses the bell curve template, where the extreme values are unexpectedly portrayed as identical and the average value looks the most distinguished; it is used to sarcastically compare levels of intelligence or competence.
- @sbunem / 59687 2023-11-14
- Template
- Bell Curve / IQ Distribution
- Type
- image
- Size
- 800×482 · 40.9 KiB
- Mood
- ироничный, абсурдный
- Added