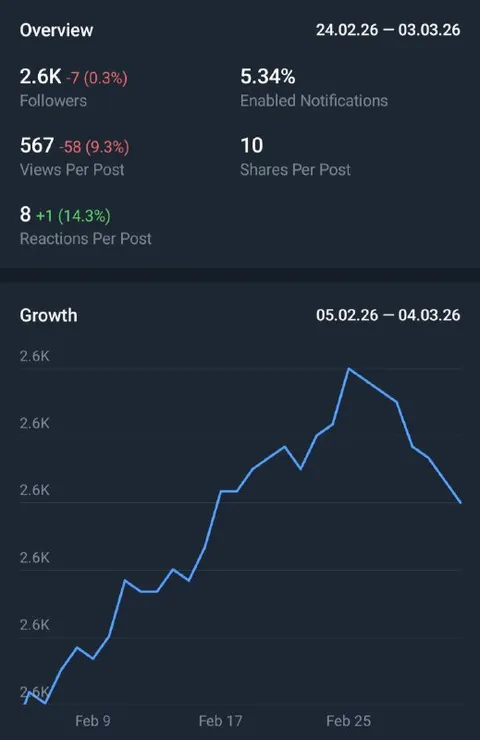
Tiny Growth, Big Decline
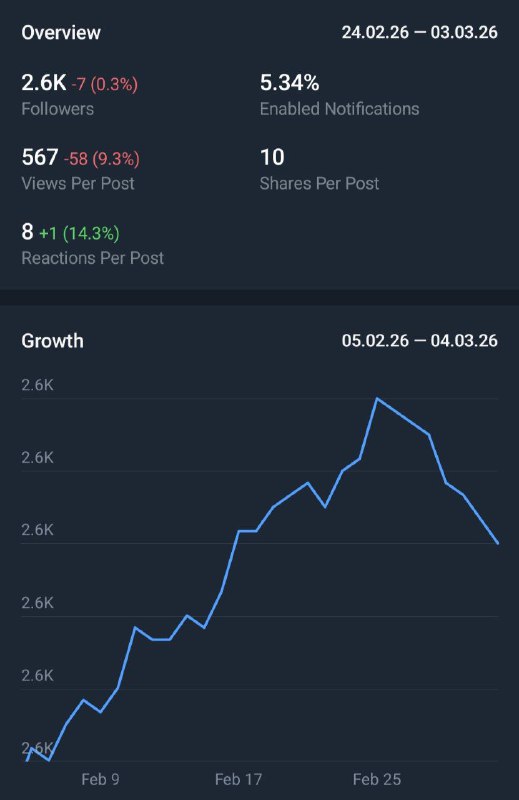
Overview 24.02.26 — 03.03.26 2.6K -7 (0.3%) Followers 5.34% Enabled Notifications 567 -58 (9.3%) Views Per Post 10 Shares Per Post 8 +1 (14.3%) Reactions Per Post Growth 05.02.26 — 04.03.26 2.6K 2.6K 2.6K 2.6K 2.6K 2.6K Feb 9 Feb 17 Feb 25
A dark-mode social media analytics dashboard shows nearly flat follower numbers, a small decline in views, and a line chart that rises sharply before falling back down. The joke is the exaggerated sense of growth followed by an underwhelming drop, making it useful as a reaction to brief success or disappointing statistics.
analytics dashboard / аналитическая панельline chart / линейный графикblue graph line / синяя линия графикаfollower count / число подписчиковnotification metric / показатель уведомленийviews metric / показатель просмотровshares metric / показатель репостовreactions metric / показатель реакцийdate range / диапазон датdark interface / тёмный интерфейс
- @pokupkabitka / 54628 2026-03-04
- Type
- image
- Size
- 519×800 · 31.1 KiB
- Mood
- ironic
- Language
- en
- Added