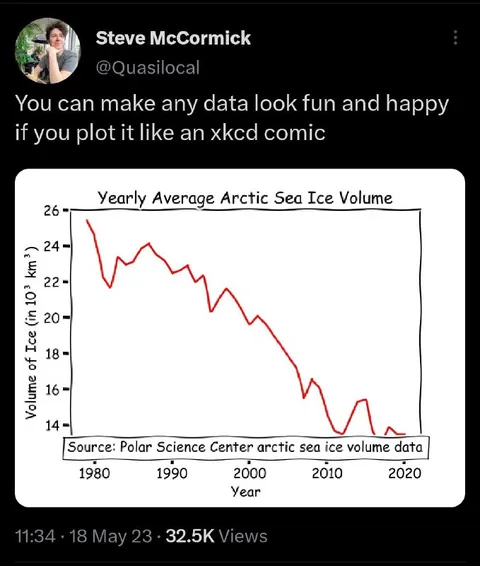
Arctic Ice as an XKCD Comic
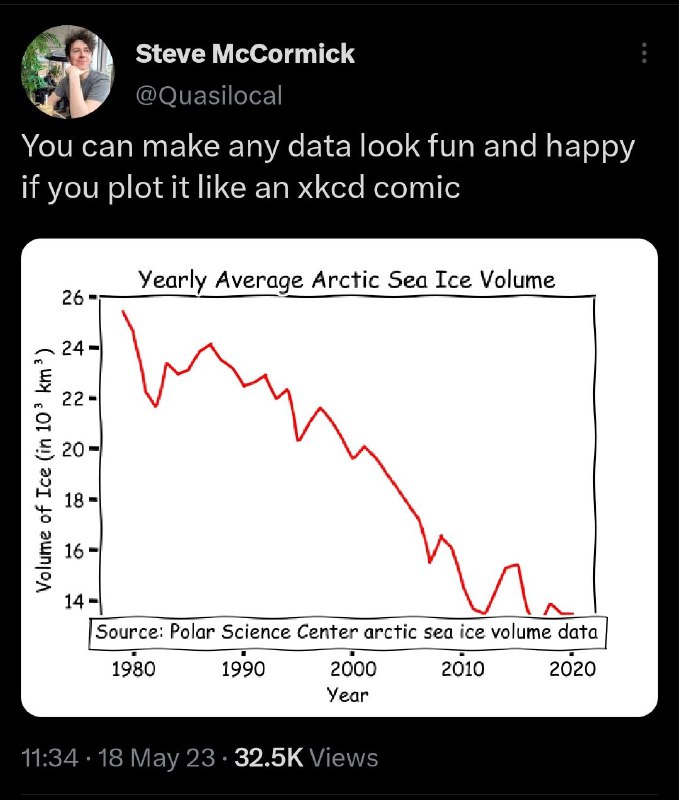
You can make any data look fun and happy if you plot it like an xkcd comic Yearly Average Arctic Sea Ice Volume Volume of Ice (in 10³ Km³) Source: Polar Science Center arctic sea ice volume data Year
A hand-drawn-style line chart shows the yearly average Arctic sea ice volume steadily declining from around 1980 to 2020. The joke is that the playful XKCD-inspired presentation makes depressing climate data look fun and happy, even though the graph shows Arctic ice loss. It works as a reaction to misleadingly cheerful data visualizations or grim facts presented in a cute format.
- @pokupkabitka / 24958 2023-05-18
- Template
- XKCD-style chart
- Type
- image
- Size
- 679×800 · 71.6 KiB
- Mood
- ironic, dark humor
- Language
- en
- Added