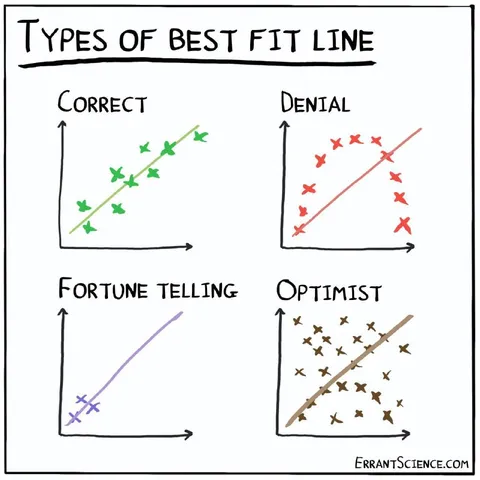
Types of Best Fit Line
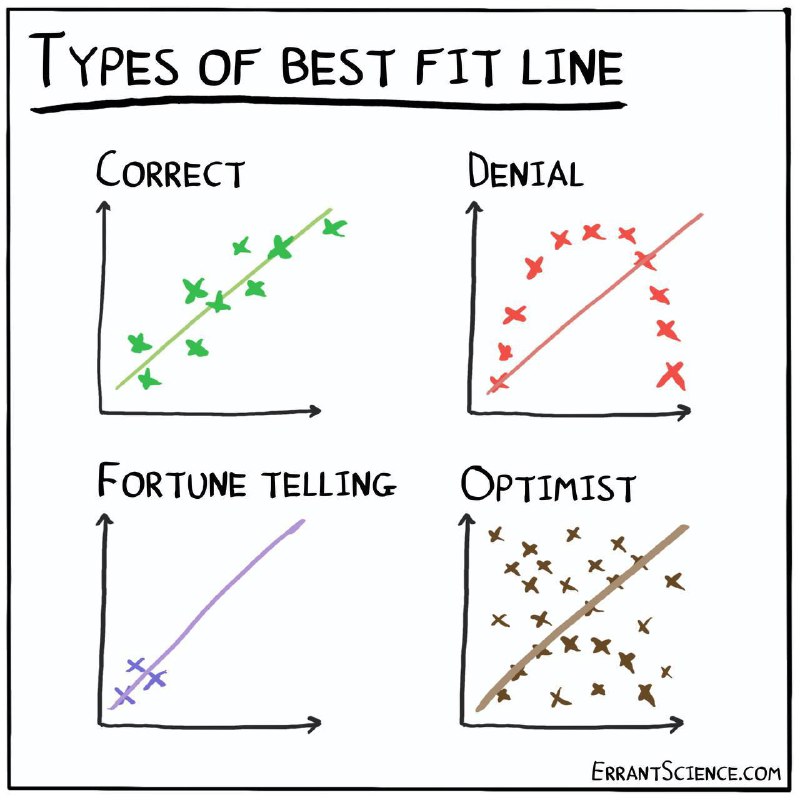
TYPES OF BEST FIT LINE CORRECT DENIAL FORTUNE TELLING OPTIMIST
A hand-drawn chart compares four ways people interpret a line of best fit: correct statistical reasoning, denial, fortune telling, and optimism. The joke is that each absurd interpretation is represented by a different pattern of scattered data points, poking fun at biased data analysis and overconfident conclusions.
hand-drawn chart / нарисованный от руки графикfour graphs / четыре графикаcoordinate axes / координатные осиdiagonal trend lines / диагональные линии трендаgreen data points / зелёные точки данныхred data points / красные точки данныхpurple data points / фиолетовые точки данныхbrown data points / коричневые точки данныхmarker handwriting / надписи маркеромwhite background / белый фон
- @ithueti / 13488 2024-07-11
- Type
- image
- Size
- 800×800 · 69.6 KiB
- Mood
- sarcastic, absurd
- Language
- en
- Added