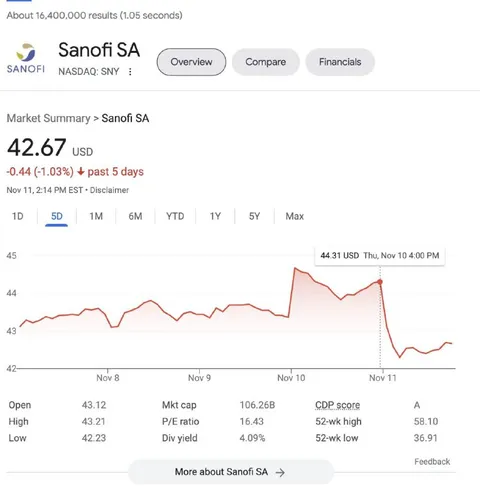
Sanofi Stock Crash Chart
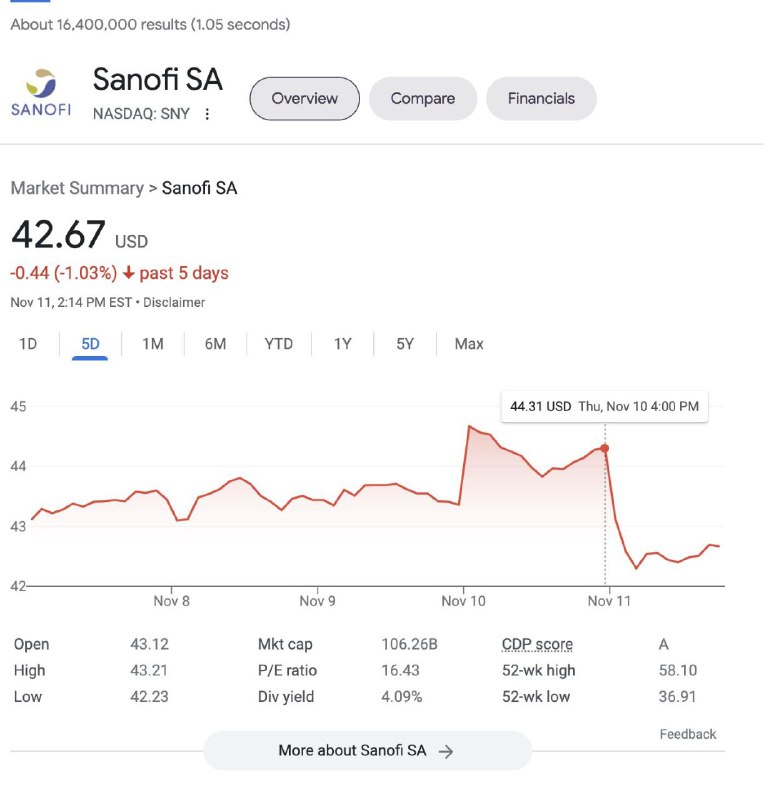
About 16,400,000 results (1.05 seconds) SANOFI Sanofi SA NASDAQ: SNY Overview Compare Financials Market Summary > Sanofi SA 42.67 USD -0.44 (-1.03%) ↓ past 5 days Nov 11, 2:14 PM EST · Disclaimer 1D 5D 1M 6M YTD 1Y 5Y Max 44.31 USD Thu, Nov 10 4:00 PM 45 44 43 42 Nov 8 Nov 9 Nov 10 Nov 11 Open 43.12 High 43.21 Low 42.23 Mkt cap 106.26B P/E ratio 16.43 Div yield 4.09% CDP score 52-wk high 52-wk low A 58.10 36.91 More about Sanofi SA → Feedback
A screenshot of Sanofi SA’s five-day stock chart shows the share price dropping sharply after a brief peak. The joke is that a viral claim about insulin manufacturers losing value is illustrated with a dramatic market crash, turning a financial chart into a reaction meme about supposedly disrupting the insulin industry. EN: A screenshot of Sanofi SA’s five-day stock chart shows the share price dropping sharply after a brief peak. The joke is that a viral claim about insulin manufacturers losing value is illustrated with a dramatic market crash, turning a financial chart into a reaction meme about supposedly disrupting the insulin industry.
stock market chart / биржевой графикline graph / линейный графикfinancial data screenshot / скриншот финансовых данныхSanofi logo / логотип Sanoficompany name / название компанииprice drop / падение ценыred trend line / красная линия трендаmarket summary / сводка рынкаGoogle search results / результаты поиска Googlechart axes / оси графикаdate labels / подписи датfinancial metrics / финансовые показатели
- @ithueti / 8148 2022-11-12
- Type
- image
- Size
- 764×800 · 53.8 KiB
- Mood
- sarcastic
- Language
- en
- Added