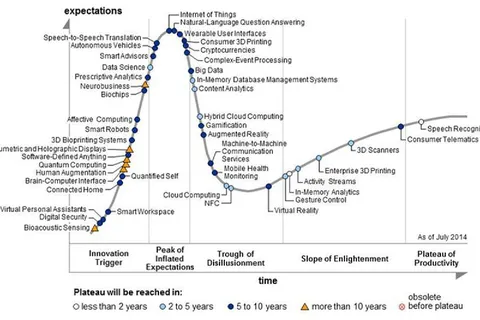
Gartner Hype Cycle of Expectations
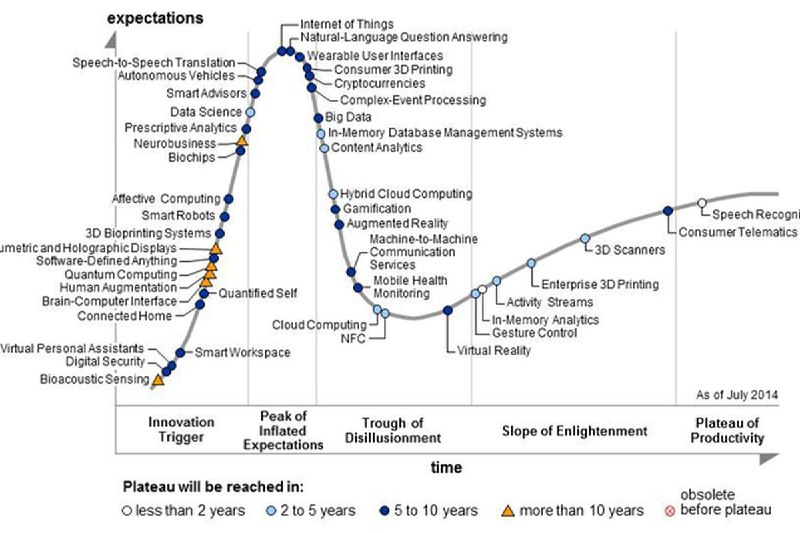
expectations Internet of Things Natural-Language Question Answering Wearable User Interfaces Consumer 3D Printing Speech-to-Speech Translation Autonomous Vehicles Smart Advisors Data Science Prescriptive Analytics Neurobusiness Biochips Cryptocurrency Complex-Event Processing Big Data In-Memory Database Management Systems Content Analytics Affective Computing Smart Robots 3D Bioprinting Systems Holographic Displays Software-Defined Anything Quantum Computing Human Augmentation Brain-Computer Interface Connected Home Hybrid Cloud Computing Gamification Augmented Reality Machine-to-Machine Communication Services Mobile Health Monitoring Quantified Self Cloud Computing NFC Virtual Personal Assistants Digital Security Bioacoustic Sensing Smart Workspace 3D Scanners Enterprise 3D Printing Activity Streams In-Memory Analytics Gesture Control Virtual Reality Speech Recognition Consumer Telematics Innovation Trigger Peak of Inflated Expectations Trough of Disillusionment Slope of Enlightenment Plateau of Productivity time As of July 2014 Plateau will be reached in: less than 2 years 2 to 5 years 5 to 10 years more than 10 years obsolete before plateau
A Gartner hype cycle chart maps emerging technologies on a curve from inflated expectations through disillusionment and enlightenment to a plateau of productivity. The joke comes from presenting the chart itself as a reaction image for situations where excitement about a new technology predictably turns into disappointment. EN: A Gartner hype cycle chart maps emerging technologies on a curve from inflated expectations through disillusionment and enlightenment to a plateau of productivity. The joke comes from presenting the chart itself as a reaction image for situations where excitement about a new technology predictably turns into disappointment.
- @ithueti / 615 2019-02-20
- Template
- Gartner Hype Cycle
- Type
- image
- Size
- 800×533 · 77.4 KiB
- Mood
- ironic, analytical
- Language
- en
- Added