LLM Picks Seven
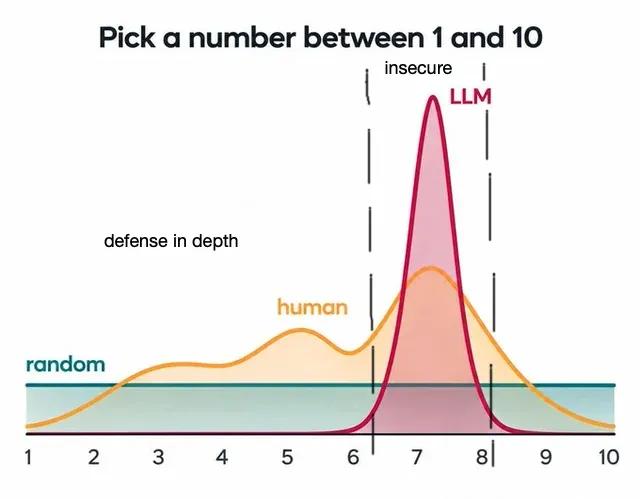
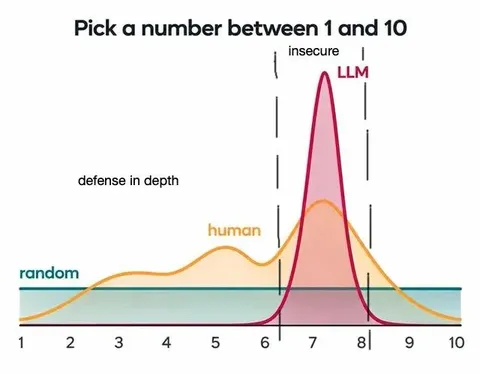
Pick a number between 1 and 10 insecure LLM defense in depth human random 1 2 3 4 5 6 7 8 9 10
A chart compares how likely a random choice, a human, and an LLM are to select numbers from 1 to 10. The LLM distribution is sharply concentrated around 7, while humans favor 5–8 and random selection is flat, implying that asking an LLM to pick a number is predictable and therefore insecure. It is used as a humorous reaction to the caption about the number 4 being hard to guess and secure from modern attacks.
chart / графикline graph / линейный графикpink distribution curve / розовая кривая распределенияorange distribution curve / оранжевая кривая распределенияteal horizontal band / бирюзовая горизонтальная полосаnumber line / числовая осьnumbers 1 to 10 / числа от 1 до 10labels / подписиvertical dashed lines / вертикальные пунктирные линииwhite background / белый фон
- @gentoomemes / 22302 2026-10-21
- Type
- image
- Size
- 640×499 · 21.3 KiB
- Mood
- sarcastic, technical
- Language
- en
- Added