What Risk Aversion Costs You
what your risk-aversion costs you Taking Risks Playing It Safe years
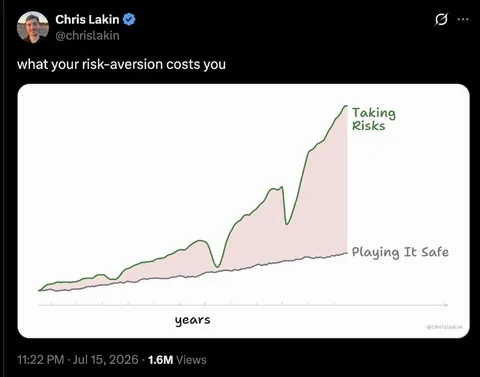
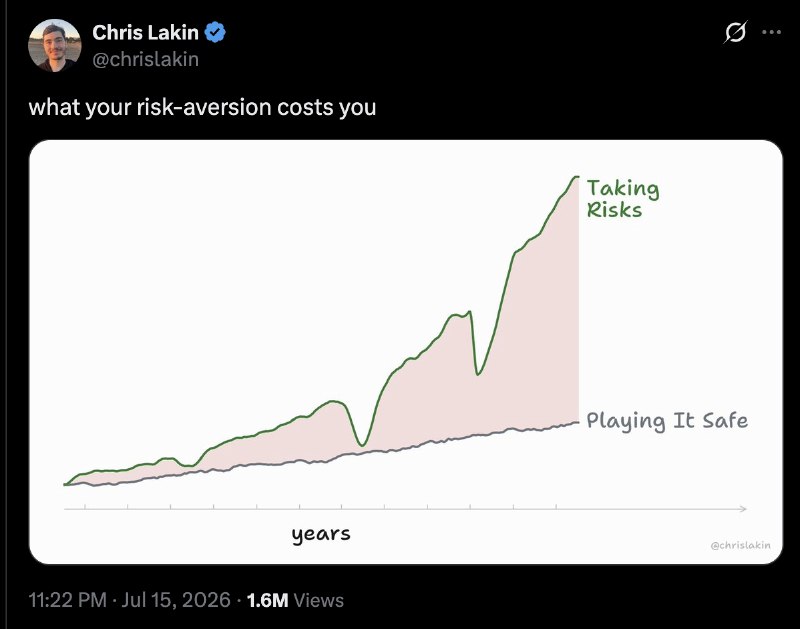
A graph compares the long-term outcomes of taking risks with playing it safe. The “Taking Risks” line rises much higher and more dramatically, while “Playing It Safe” stays nearly flat, joking that excessive caution can cost you growth and opportunity. It is used as a reaction to discussions about career, business, investing, or life choices. EN: A graph compares the long-term outcomes of taking risks with playing it safe. The “Taking Risks” line rises much higher and more dramatically, while “Playing It Safe” stays nearly flat, joking that excessive caution can cost you growth and opportunity. It is used as a reaction to discussions about career, business, investing, or life choices.
line graph / линейный графикgreen rising line / зелёная восходящая линияgray flat line / серая ровная линияpink shaded area / розовая затенённая областьx-axis / ось Xarrow / стрелкаyears label / подпись «years»white chart panel / белая панель графикаblack background / чёрный фонrisk comparison / сравнение рисков
- @rzeczyzabawne / 23737 2026-10-23
- Type
- image
- Size
- 800×629 · 37.7 KiB
- Mood
- motivational, ironic
- Language
- en
- Added