Ethnic Composition of Taiwan
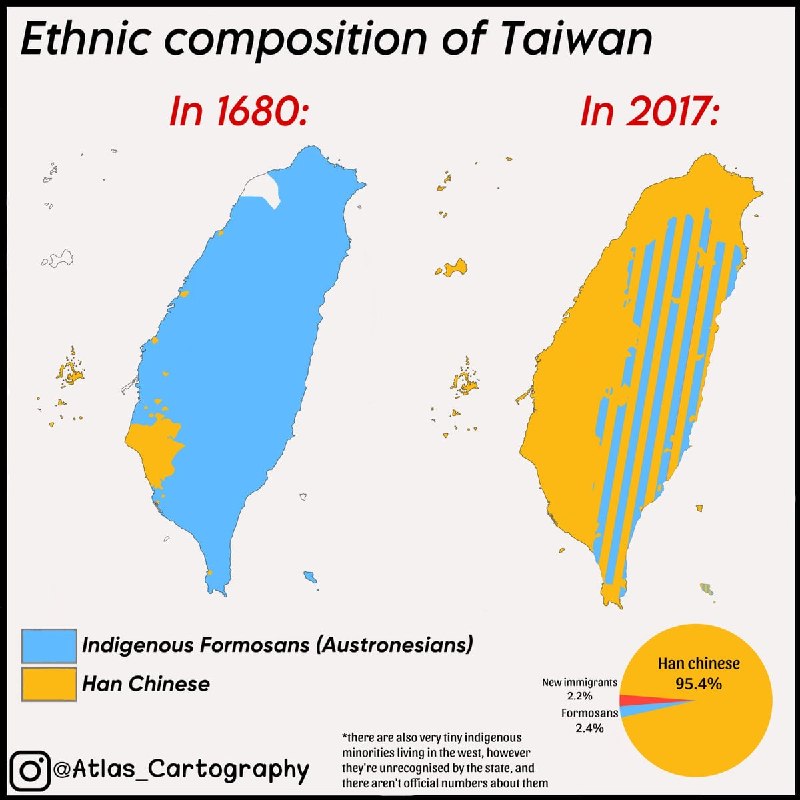
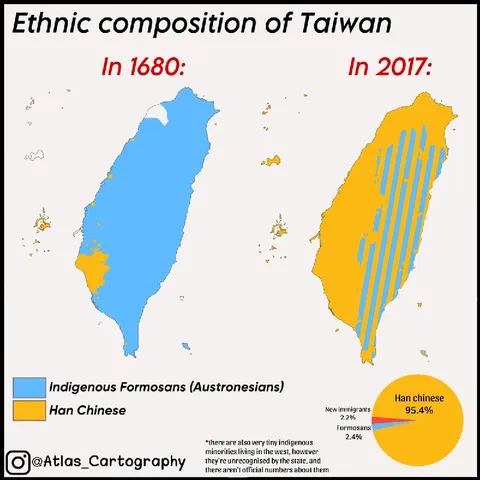
Ethnic composition of Taiwan In 1680: In 2017: Indigenous Formosans (Austronesians) Han Chinese Han chinese 95.4% New immigrants 2.2% Formosans 2.4% *there are very tiny indigenous minorities living in the west, however they're unrecognised by the state, and there aren't official numbers about them
A comparison graphic shows Taiwan’s ethnic composition in 1680 and 2017, with blue representing Indigenous Formosans and yellow representing Han Chinese. The joke highlights the dramatic demographic shift and the near-total dominance of Han Chinese in the 2017 chart, while noting that small Indigenous minorities in western Taiwan are not officially counted. It is shared as a political or historical reaction about colonization, migration, and demographic change.
map of Taiwan / карта Тайваняtwo comparison panels / две сравнительные панелиblue map area / синяя область на картеyellow map area / жёлтая область на картеpie chart / круговая диаграммаlegend / легендаblue color swatch / синяя цветовая плашкаyellow color swatch / жёлтая цветовая плашкаmap islands / острова на картеpercentage labels / обозначения процентовInstagram logo / логотип Instagram
- @antichirst / 23373 2026-10-04
- Type
- image
- Size
- 800×800 · 84.6 KiB
- Mood
- political, ironic
- Language
- en
- Added