Daily Protein Sources by Region
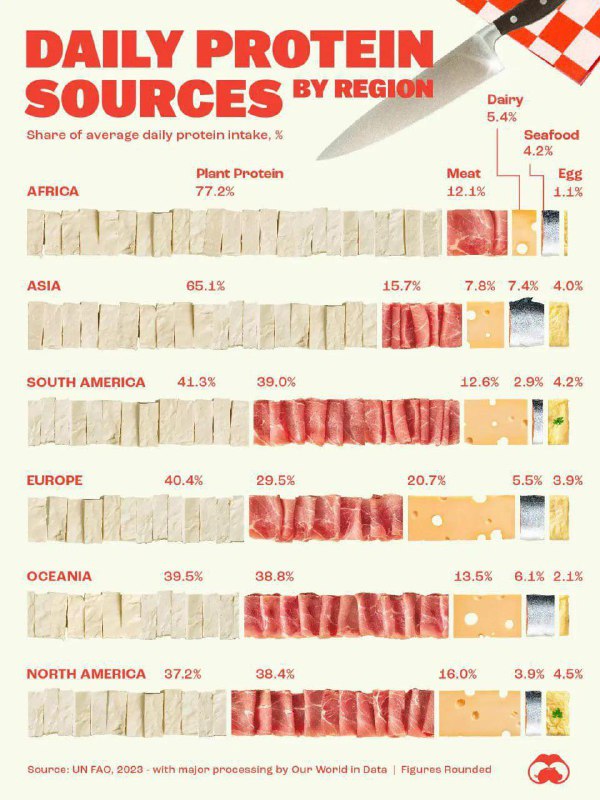
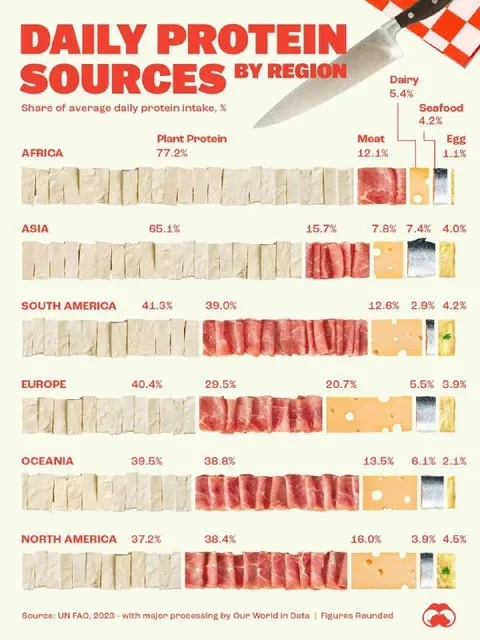
DAILY PROTEIN SOURCES BY REGION Share of average daily protein intake, % Dairy 5.4% Seafood 4.2% Egg 1.1% Plant Protein 77.2% Meat 12.1% AFRICA ASIA 65.1% 15.7% 7.8% 7.4% 4.0% SOUTH AMERICA 41.3% 39.0% 12.6% 2.9% 4.2% EUROPE 40.4% 29.5% 20.7% 5.5% 3.9% OCEANIA 39.5% 38.8% 13.5% 6.1% 2.1% NORTH AMERICA 37.2% 38.4% 16.0% 3.9% 4.5%
A humorous infographic compares daily protein sources across Africa, Asia, South America, Europe, Oceania, and North America using bars made from tofu, meat, cheese, seafood, and egg imagery. The joke is the absurdly literal visual chart, where each protein category is represented by a strip of the corresponding food. It is shared as a reaction to exaggerated nutrition statistics or funny data visualizations. EN: A humorous infographic compares daily protein sources across Africa, Asia, South America, Europe, Oceania, and North America using bars made from tofu, meat, cheese, seafood, and egg imagery. The joke is the absurdly literal visual chart, where each protein category is represented by a strip of the corresponding food. It is shared as a reaction to exaggerated nutrition statistics or funny data visualizations.
- @antichirst / 20080 2025-07-11
- Type
- image
- Size
- 600×800 · 101.9 KiB
- Mood
- absurd, informative
- Language
- en
- Added