US Intervention Sunspot Theory
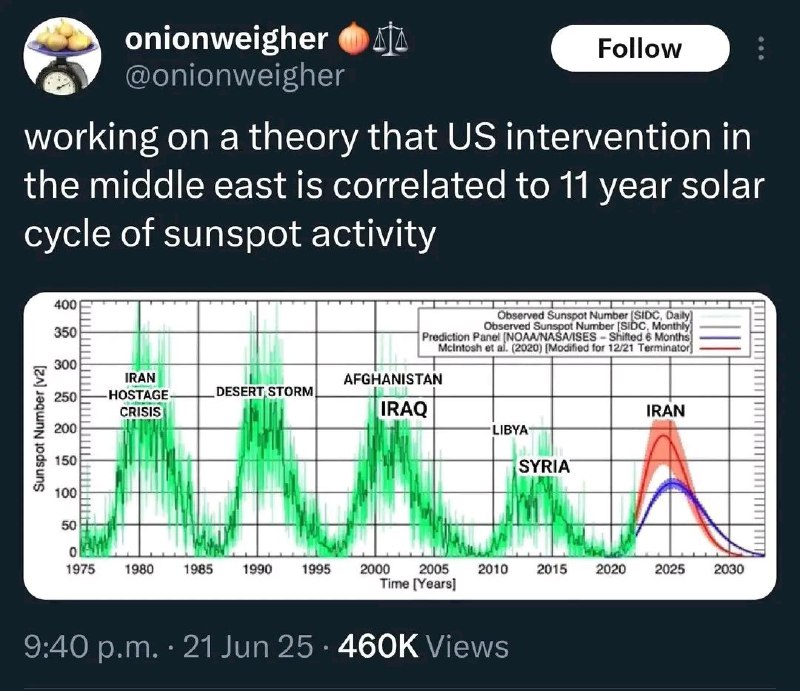
working on a theory that US intervention in the middle east is correlated to 11 year solar cycle of sunspot activity Sunspot Number [v2] Observed Sunspot Number (SIDC, Daily) Observed Sunspot Number (SIDC, Monthly) Prediction Panel (NOAA/NASA/ISES - Shifted 6 Months McIntosh et al., 2020) [Modified for 12/21 Terminator IRAN HOSTAGE CRISIS DESERT STORM AFGHANISTAN IRAQ LIBYA SYRIA IRAN Time [Years]
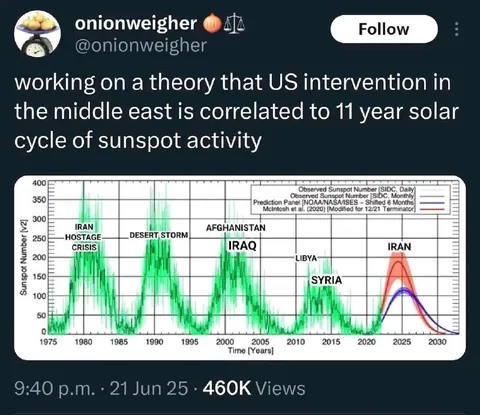
A tweet presents a deliberately conspiratorial theory that U.S. interventions in the Middle East line up with the roughly 11-year solar cycle of sunspot activity, using a sunspot graph labeled with wars and crises. The joke is the absurd correlation: a scientific-looking chart is used to imply that solar activity predicts geopolitical events. It is shared as a reaction to elaborate conspiracy theories, cherry-picked data, or overconfident explanations. EN: A tweet presents a deliberately conspiratorial theory that U.S. interventions in the Middle East line up with the roughly 11-year solar cycle of sunspot activity, using a sunspot graph labeled with wars and crises. The joke is the absurd correlation: a scientific-looking chart is used to imply that solar activity predicts geopolitical events. It is shared as a reaction to elaborate conspiracy theories, cherry-picked data, or overconfident explanations.
- @antichirst / 19903 2025-06-23
- Template
- tweet screenshot
- Type
- image
- Size
- 800×691 · 113.1 KiB
- Mood
- саркастичный, абсурдный
- Language
- en
- Added