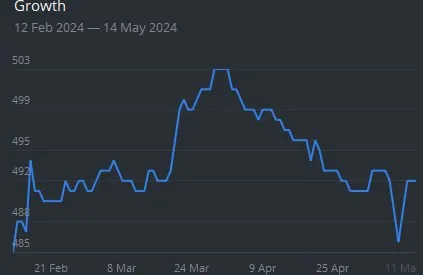
Growth Chart Goes Up and Down
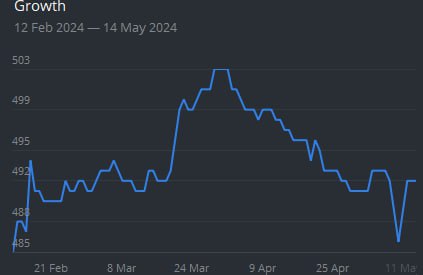
Growth 12 Feb 2024 — 14 May 2024 503 499 495 492 488 485 21 Feb 8 Mar 24 Mar 9 Apr 25 Apr 11 May
A dark-themed line chart titled “Growth” shows a fluctuating trend from February to May, with a sharp rise in late March followed by a gradual decline and a final dip. The joke is the ironic contrast between the optimistic title and the mostly downward, unstable graph, making it suitable as a reaction to failed progress or declining results.
- @antichirst / 16698 2024-05-15
- Type
- image
- Size
- 423×275 · 10.2 KiB
- Mood
- ironic, absurd
- Language
- en
- Added