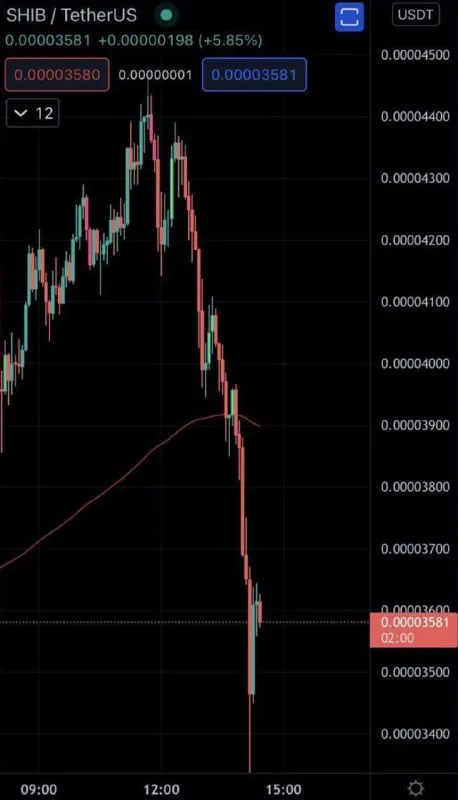
SHIB Price Crash Chart
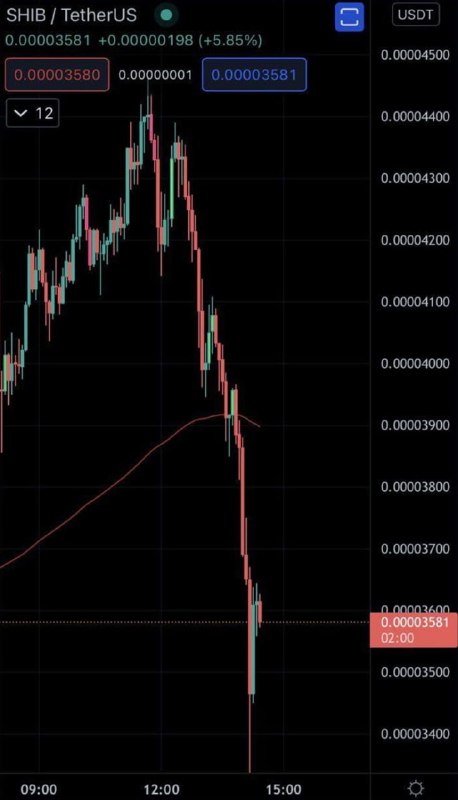
SHIB / TetherUS 0.00003581 +0.00000198 (+5.85%) USDT 0.00003580 0.00000001 0.00003581 12 0.00004500 0.00004400 0.00004300 0.00004200 0.00004100 0.00004000 0.00003900 0.00003800 0.00003700 0.00003581 02:00 0.00003500 0.00003400 09:00 12:00 15:00
A cryptocurrency candlestick chart for SHIB against TetherUS shows a sharp vertical plunge in price near the afternoon. The joke is the exaggerated visual of a meme coin suddenly crashing, making it useful as a reaction to financial loss, panic selling, or a disastrous decision. EN: A cryptocurrency candlestick chart for SHIB against TetherUS shows a sharp vertical plunge in price near the afternoon. The joke is the exaggerated visual of a meme coin suddenly crashing, making it useful as a reaction to financial loss, panic selling, or a disastrous decision.
cryptocurrency chart / график криптовалютыcandlesticks / свечиsharp price drop / резкое падение ценыred candlestick / красная свечаgreen candlestick / зелёная свечаblack background / чёрный фонprice scale / шкала ценыtime scale / шкала времениSHIB token / токен SHIBUSDT label / обозначение USDTline indicator / линейный индикатор
- @afrosidemoon / 43842 2021-10-25
- Type
- image
- Size
- 458×800 · 42.3 KiB
- Mood
- panicked
- Language
- en
- Added