
iPods Sold (cum)
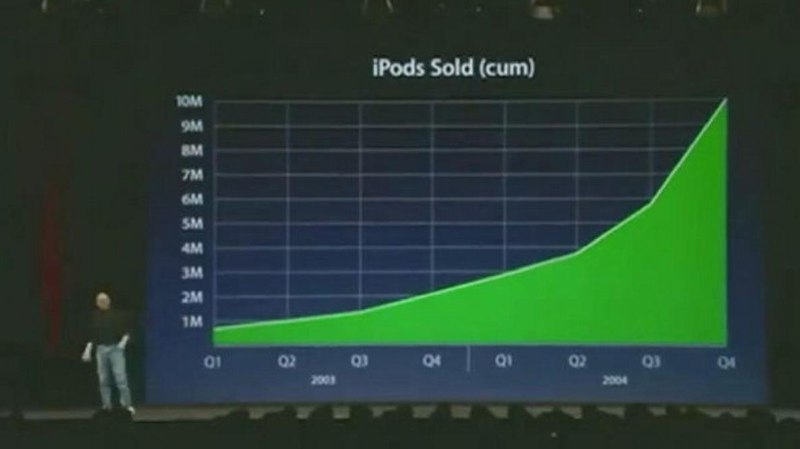
iPods Sold (cum) 10M 9M 8M 7M 6M 5M 4M 3M 2M 1M Q1 Q2 Q3 Q4 Q1 Q2 Q3 Q4 2003 2004
A presentation slide shows a bright green area chart labeled “iPods Sold (cum)” rising sharply from 2003 to 2004. The joke is the accidental sexual double meaning of “cum,” making an ordinary sales graph look vulgar and absurd. It is typically sent as a reaction to awkward wording, unexpected innuendo, or a suspiciously suggestive chart. EN: A presentation slide shows a bright green area chart labeled “iPods Sold (cum)” rising sharply from 2003 to 2004. The joke is the accidental sexual double meaning of “cum,” making an ordinary sales graph look vulgar and absurd. It is typically sent as a reaction to awkward wording, unexpected innuendo, or a suspiciously suggestive chart.
presentation screen / экран презентацииgreen area chart / зелёный график с заливкойsales graph / график продажrising line / восходящая линияiPod sales data / данные о продажах iPoddark stage / тёмная сценаpresenter / докладчикprojector screen / проекционный экранquarter labels / обозначения кварталовyear labels / обозначения годов
- @afrosidemoon / 26098 2020-04-17
- Type
- image
- Size
- 800×449 · 31.0 KiB
- Mood
- absurd, suggestive
- Language
- en
- Added