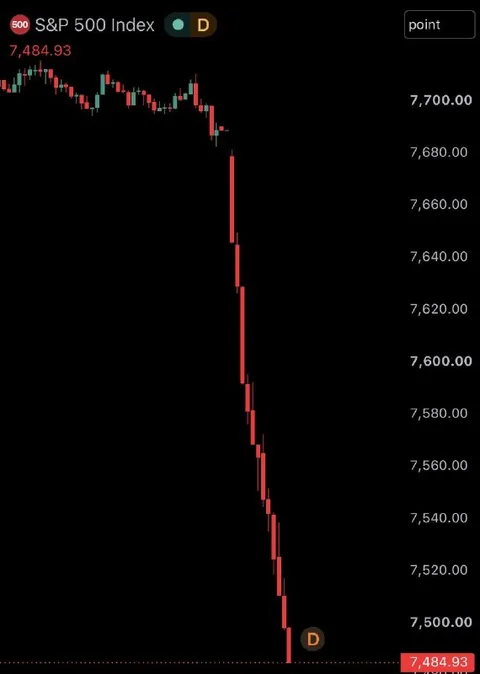
S&P 500 Freefall
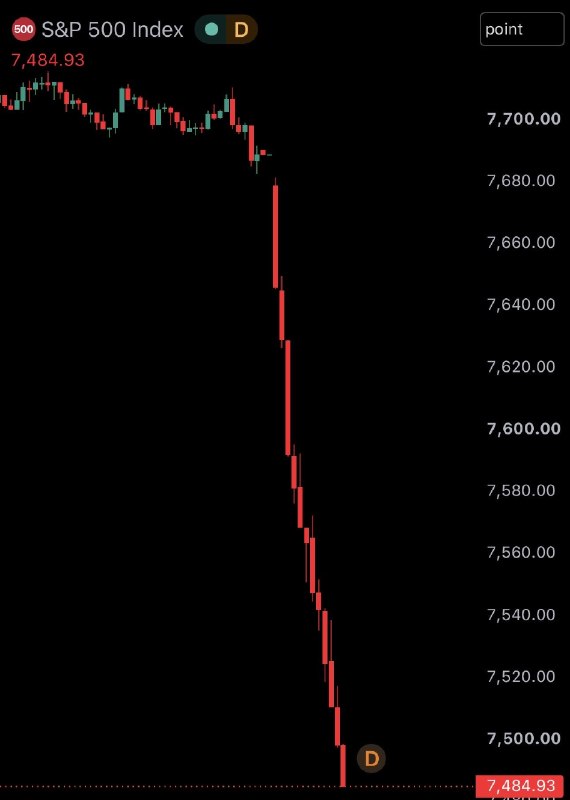
S&P 500 Index D point 7,484.93 7,700.00 7,680.00 7,660.00 7,640.00 7,620.00 7,600.00 7,580.00 7,560.00 7,540.00 7,520.00 7,500.00 7,484.93
A dark trading chart labeled “S&P 500 Index” shows a dramatic near-vertical red plunge from around 7,700 to 7,484.93. The exaggerated crash is used as a reaction to sudden financial losses, market panic, or disastrous news. It pairs ironically with the attached claim about the stock market losing trillions in the first hour of trading. EN: A dark trading chart labeled “S&P 500 Index” shows a dramatic near-vertical red plunge from around 7,700 to 7,484.93. The exaggerated crash is used as a reaction to sudden financial losses, market panic, or disastrous news. It pairs ironically with the attached claim about the stock market losing trillions in the first hour of trading.
stock market chart / биржевой графикred candlesticks / красные свечиgreen candlesticks / зелёные свечиfalling line / падающая линияprice axis / ценовая шкалаblack background / чёрный фонtrading interface / торговый интерфейсS&P 500 label / надпись S&P 500decimal price display / отображение цены с десятичными знаками
- @antichirst / 23750 2026-11-05
- Type
- image
- Size
- 570×800 · 28.6 KiB
- Mood
- panicked, sarcastic
- Language
- en
- Added