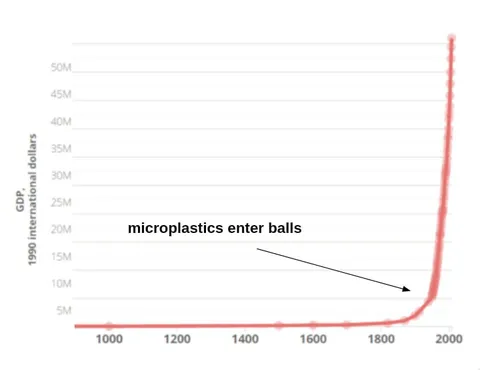
Microplastics Enter Balls Graph
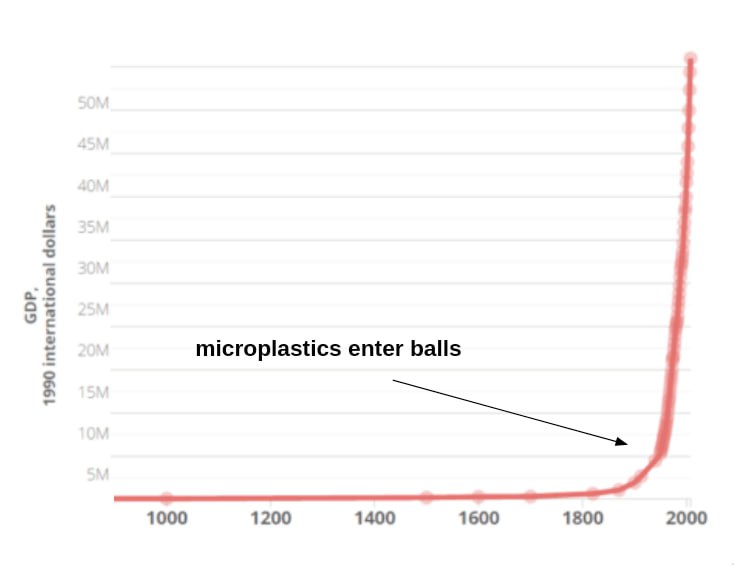
50M 45M 40M 35M 30M 25M 20M 15M 10M 5M GDP- 1990 international dollars 1000 1200 1400 1600 1800 2000 microplastics enter balls
A red line graph stays nearly flat for centuries before rising sharply near the year 2000, with an arrow pointing to the surge and the caption “microplastics enter balls.” The joke falsely presents microplastic contamination as the explanation for explosive GDP growth, making it a surreal chart parody for absurd or pseudo-scientific reactions.
- @rzeczyzabawne / 16690 2024-05-25
- Type
- image
- Size
- 734×567 · 24.4 KiB
- Mood
- absurd, sarcastic
- Language
- en
- Added