New Relic Error Rate Message
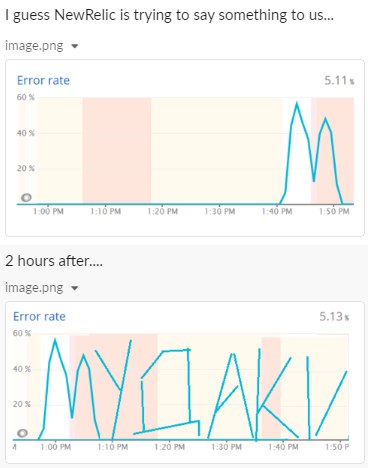
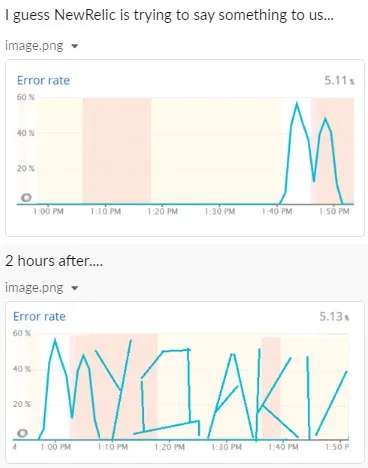
I guess NewRelic is trying to say something to us... Error rate 60% 1:00 PM 1:10 PM 1:20 PM 1:30 PM 1:40 PM 1:50 PM 2 hours after.... Error rate 60% 1:00 PM 1:10 PM 1:20 PM 1:30 PM 1:40 PM 1:50 PM
A two-panel screenshot shows New Relic error-rate graphs. The first graph has a mostly flat line with two sharp spikes, while two hours later the graph’s jagged line appears to form a message or symbols. The joke is that the monitoring system seems to be communicating through the error chart, making this a reaction to strange outages or inexplicable technical failures. EN: A two-panel screenshot shows New Relic error-rate graphs. The first graph has a mostly flat line with two sharp spikes, while two hours later the graph’s jagged line appears to form a message or symbols. The joke is that the monitoring system seems to be communicating through the error chart, making this a reaction to strange outages or inexplicable technical failures.
computer screenshot / скриншот компьютераerror-rate graph / график уровня ошибокline chart / линейный графикturquoise graph line / бирюзовая линия графикаsharp spike / резкий скачокflat baseline / ровная базовая линияtime axis / временная шкалаpercentage scale / процентная шкалаmonitoring dashboard / панель мониторингаcolored chart background / цветной фон графика
- @profunctor_io / 5894 2020-11-26
- Type
- image
- Size
- 368×468 · 26.4 KiB
- Mood
- absurd, sarcastic
- Language
- en
- Added