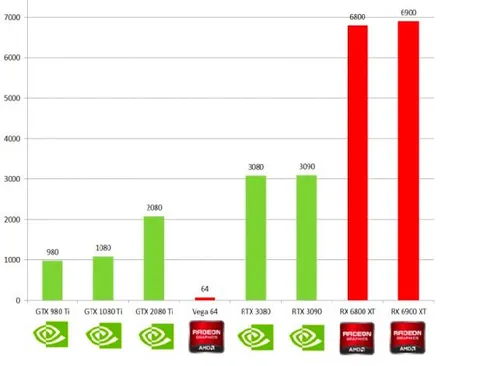
GPU Performance Comparison Chart
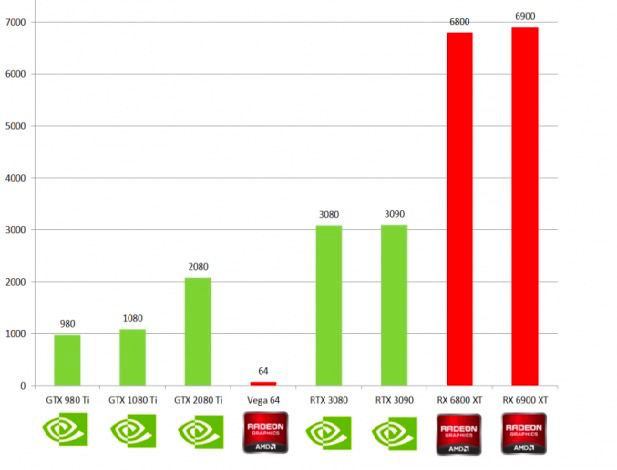
7000 6000 5000 4000 3000 2000 1000 0 980 1080 2080 64 3080 3090 6800 6900 GTX 980 Ti GTX 1080 Ti GTX 2080 Ti Vega 64 RTX 3080 RTX 3090 RX 6800 XT RX 6900 XT RADEON GRAPHICS AMD
A bar chart compares the performance of several NVIDIA and AMD graphics cards. The joke is the dramatic jump from Vega 64 to the newer RX 6800 XT and RX 6900 XT, presenting AMD’s comeback as towering over the previous results. It can be shared as a reaction to unexpectedly strong hardware performance or a generational leap. EN: A bar chart compares the performance of several NVIDIA and AMD graphics cards. The joke is the dramatic jump from Vega 64 to the newer RX 6800 XT and RX 6900 XT, presenting AMD’s comeback as towering over the previous results. It can be shared as a reaction to unexpectedly strong hardware performance or a generational leap.
- @profunctor_io / 5706 2020-10-31
- Type
- image
- Size
- 617×470 · 24.9 KiB
- Mood
- triumphant
- Language
- en
- Added