Every Time Series Career
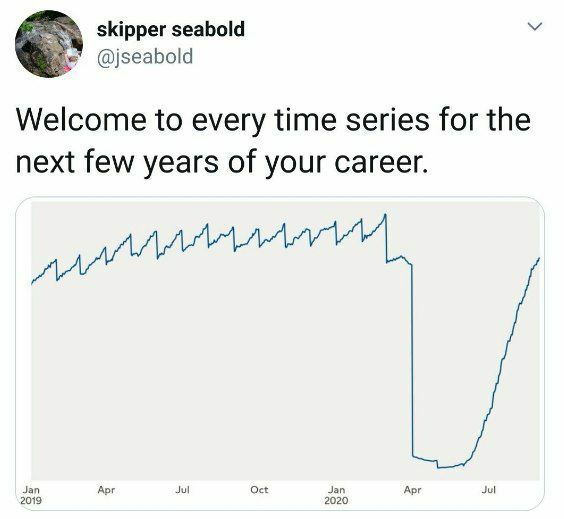
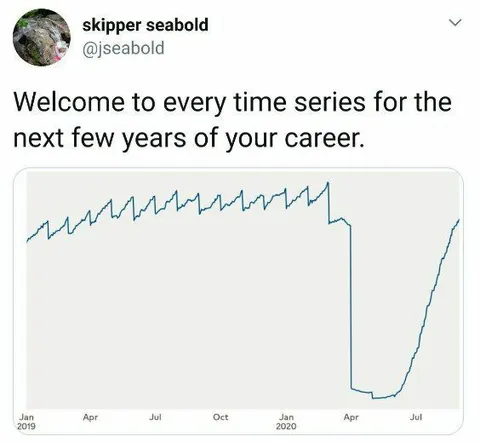
Welcome to every time series for the next few years of your career. Jan 2019 Apr Jul Oct Jan 2020 Apr Jul
A line chart shows repeated small rises and drops, followed by a dramatic collapse and gradual recovery. The joke compares a career’s likely cycle of progress, setbacks, and burnout to a time series graph, making it a relatable reaction to long-term career instability.
- @profunctor_io / 5686 2020-10-28
- Type
- image
- Size
- 564×519 · 29.5 KiB
- Mood
- sarcastic, relatable
- Language
- en
- Added