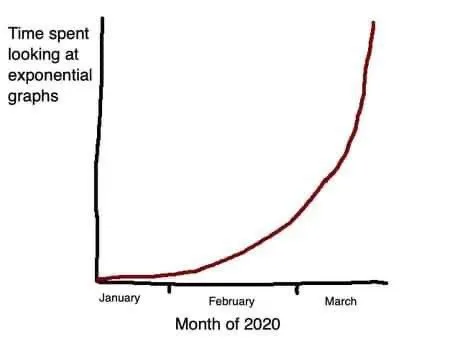
Time Spent Looking at Exponential Graphs
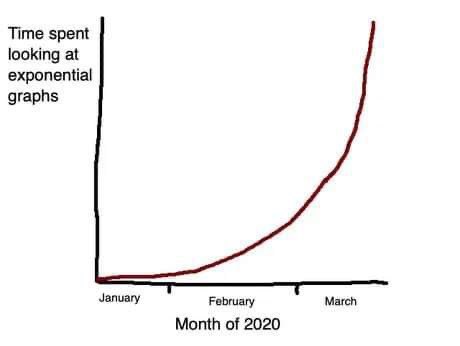
Time spent looking at exponential graphs January February March Month of 2020
A simple line graph shows time spent looking at exponential graphs staying low in January and February, then rising sharply in March. The joke is a topical reaction to the sudden explosion of interest in exponential growth during the COVID-19 pandemic, often used when discussing rapidly increasing cases or trends.
- @profunctor_io / 4265 2020-03-28
- @afrosidemoon / 25195 2020-03-28
- Type
- image
- Size
- 460×346 · 10.6 KiB
- Mood
- ироничный
- Language
- en
- Added