Career in IT Graph
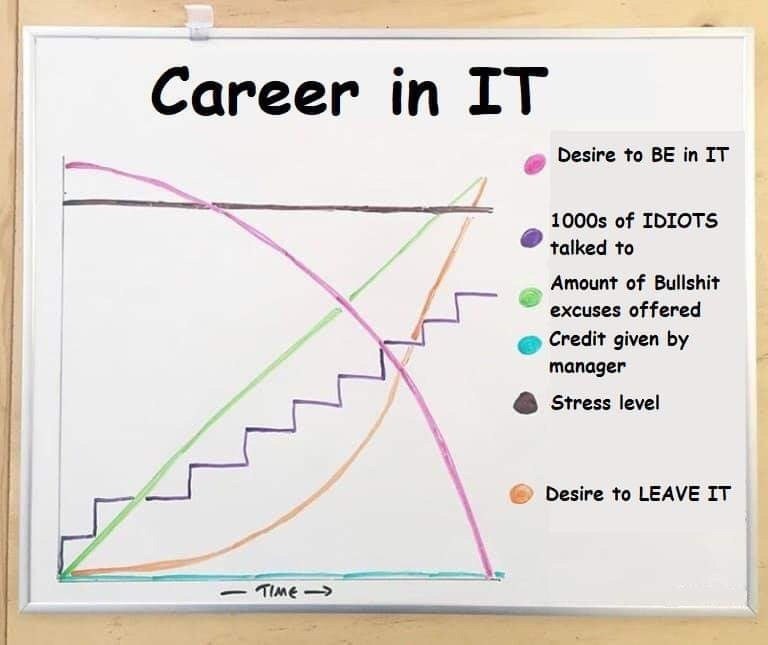
Career in IT Desire to BE in IT 1000s of IDIOTS talked to Amount of Bullshit excuses offered Credit given by manager Stress level Desire to LEAVE IT - TIME →
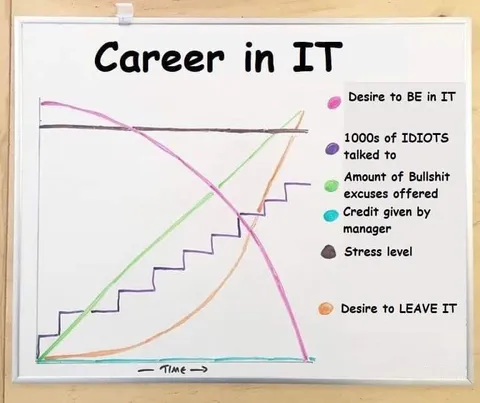
A hand-drawn graph titled “Career in IT” shows desire to be in IT and the amount of bullshit excuses increasing over time, while stress and the desire to leave IT also rise. The punchline is that dealing with idiots, excuses, and low manager credit makes an IT career increasingly stressful and ultimately drives the worker to quit. It is sent as a relatable workplace reaction by IT professionals frustrated with their jobs.
whiteboard / белая доскаhand-drawn graph / нарисованный от руки графикcolored lines / цветные линииpink line / розовая линияpurple staircase / фиолетовая лестницаgreen rising line / зелёная восходящая линияorange rising curve / оранжевая восходящая криваяblue horizontal line / синяя горизонтальная линияblack horizontal line / чёрная горизонтальная линияcolored legend dots / цветные точки легендыwall / стенаtape / скотчtime axis / ось времени
- @profunctor_io / 3993 2020-02-08
- @right_wing_dev_squads / 6179 2023-03-20
- Type
- image
- Size
- 768×645 · 44.0 KiB
- Mood
- саркастичный, frustrated
- Language
- en
- Added