Christmas Regression Risk Chart
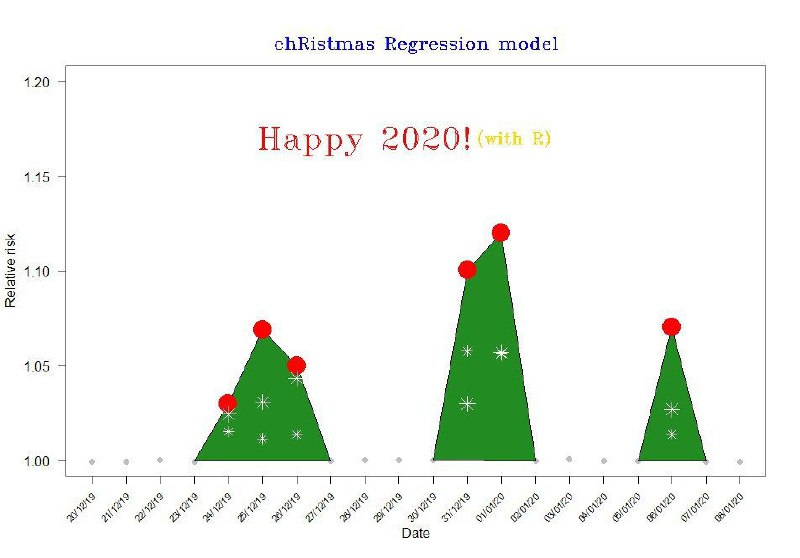
chRistmas Regression model Happy 2020! (with R) Relative risk Date 20/12/19 21/12/19 22/12/19 23/12/19 24/12/19 25/12/19 26/12/19 27/12/19 28/12/19 29/12/19 30/12/19 31/12/19 01/01/20 02/01/20 03/01/20 04/01/20 05/01/20 06/01/20 07/01/20 08/01/20
A mock statistical chart titled “chRistmas Regression model” shows green Christmas-tree-shaped peaks with red ornaments and the greeting “Happy 2020! (with R)”. The joke is that Christmas and New Year celebrations are represented as a regression graph, with holiday risk rising in tree-like spikes; “with R” refers to the R programming language and statistical modeling. EN: A mock statistical chart titled “chRistmas Regression model” shows green Christmas-tree-shaped peaks with red ornaments and the greeting “Happy 2020! (with R)”. The joke is that Christmas and New Year celebrations are represented as a regression graph, with holiday risk rising in tree-like spikes; “with R” refers to the R programming language and statistical modeling.
- @profunctor_io / 3724 2019-12-26
- Type
- image
- Size
- 800×558 · 44.3 KiB
- Mood
- absurd, nerdy
- Language
- en
- Added